Demand forecasting methods are the different ways businesses predict how much customers will want to buy.Demand forecast methods are the different ways businesses try to predict how much customers will want to buy in the future. These techniques range from simple math based on your past sales data to sophisticated AI-driven models that pull in things like market trends, giving you a surprisingly clear peek at what's coming.

Trying to run an e-commerce store without a demand forecast is like captaining a cargo ship without a weather report. Sure, you know your destination, but you’re essentially sailing blind into potential storms, completely unsure of what’s just over the horizon. That kind of uncertainty hits your bottom line, hard.
Think of forecasting as your business's personal weather service. It reads the historical patterns and current market signals to paint a data-driven picture of the sales conditions ahead. This foresight is absolutely essential for dodging the two costliest inventory mistakes in the e-commerce world.
Without a reliable forecast, you're just guessing how much stock to order. This almost always leads to one of two expensive headaches:
A reliable forecast is the bridge between your past sales data and your future inventory decisions. It turns reactive guessing into proactive, strategic planning that protects your cash flow and keeps your customers coming back.
We'll break down the major forecasting approaches into a few key categories, from the straightforward to the more advanced.
Here’s a quick overview of what we'll be covering to help you get your bearings.
This table gives you a high-level look at the main families of forecasting methods, what they're good for, and the kind of data they need to work their magic.
| Method Category | Core Principle | Best For | Data Needs |
|---|---|---|---|
| Time-Series Analysis | Uses past sales data to find patterns and project them into the future. | Stable products with a solid sales history; identifying seasonality and trends. | Clean, historical sales data (daily, weekly, or monthly). |
| Causal Models | Connects demand to specific internal or external factors (e.g., promotions, economic trends). | Understanding why demand changes; forecasting the impact of marketing campaigns. | Sales data plus data on causal factors (e.g., ad spend, competitor pricing). |
| Machine Learning (ML) | Uses advanced algorithms to learn complex, non-linear patterns from vast datasets. | Highly complex demand patterns; forecasting for many SKUs at once. | Large, diverse datasets (sales, web traffic, social media trends, etc.). |
| Judgmental Methods | Relies on human expertise, intuition, and qualitative feedback. | New product launches or situations with no historical data. | Expert opinions, market surveys, and qualitative insights. |
Understanding these different demand forecast methods is the first real step toward building that bridge. The right approach for you depends entirely on your products, your data, and what you’re trying to achieve. In this guide, we'll walk through the essential techniques every Shopify merchant should know, giving you a clear roadmap from basic concepts to more powerful applications.
Our goal is to cover a range of options so you can find the perfect fit for your store’s unique needs and finally take confident control of your inventory.

The most common and trusted demand forecast methods are all rooted in time-series analysis. Think of it like driving a car: you check the rearview mirror to understand the road you've just traveled, which helps you anticipate what’s coming up. Time-series models do the exact same thing for your business, using historical sales data to project future demand.
These quantitative techniques operate on a simple but powerful assumption: that past patterns—like trends, seasonal spikes, and cycles—are likely to continue. For many e-commerce products with a stable sales history, this is a remarkably effective way to build a solid forecast.
Let's break down some of the most essential time-series methods you'll encounter.
Imagine your weekly sales data looks like a jagged mountain range, full of sharp peaks and sudden valleys. A Simple Moving Average (SMA) is one of the most straightforward ways to smooth out all that volatility. It works by calculating the average sales over a specific recent period, say, the last four weeks.
As each new week passes, the oldest week's data is dropped and the newest one is added in, creating a "moving" average. This simple trick helps filter out random noise—like a one-off flash sale—to reveal the underlying sales trend. It's a great starting point for products with relatively steady demand, but it can be slow to react to new trends because it gives equal importance to all data points in its calculation window.
But what if your most recent sales are a much better predictor of the future than what you sold three months ago? This is where Exponential Smoothing really shines. It’s a more sophisticated technique that assigns progressively less weight to older data points, making it far more responsive to recent shifts in demand.
For example, a global retail chain with stores in over 20 countries adopted exponential smoothing to forecast demand for its core products. By applying this method to 24 months of historical sales data, the company cut its forecast errors by 22% and boosted inventory turnover by 15%. Because it prioritizes recent activity, the model is much better at catching emerging trends than a simple moving average.
This responsiveness is crucial. If sales for a particular SKU suddenly start trending upward, an exponential smoothing model will reflect that change much faster, allowing you to adjust your inventory orders before you run into a stockout.
While the previous methods are powerful, they can sometimes struggle with more complex patterns in your data. Enter the AutoRegressive Integrated Moving Average (ARIMA) model, a more advanced statistical tool that can handle intricate details within your sales history. It’s like having a seasoned analyst who can expertly identify and model multiple components at once.
ARIMA is particularly effective because it can account for several key factors simultaneously:
In practical terms, ARIMA can masterfully detect things like seasonality (a spike in sunscreen sales every summer) and long-term growth trends. It’s more complex to set up, but it often provides a much clearer and more accurate picture of what’s to come, especially for products with distinct seasonal cycles. Identifying these high-value, cyclical products is a key part of inventory management, and you can learn how to segment them using an ABC XYZ analysis for your Shopify store.
While time-series models are fantastic for making sense of the past, modern e-commerce is often too wild for historical data alone. To get a real edge, you have to understand the why behind your sales numbers. This is where more advanced demand forecasting methods step in, helping you predict the unpredictable by connecting sales to their actual root causes.
These models go way beyond just looking at a sales timeline. They act more like investigative tools, digging into the relationships between your sales and the world around them—everything from your latest marketing blitz to a competitor's surprise sale.
Ever wondered exactly how much a 15% off coupon boosts sales for a specific product? Or how a dip in the economy might affect demand for your luxury goods? Causal models are built to answer exactly these kinds of questions. They draw a clear mathematical line between your sales volume and the external or internal factors that push it up or down.
Think of it like being a business detective. Instead of just noting that sales spiked, you're identifying the specific clues—the causes—that led to that outcome.
These drivers can be almost anything:
Once you understand these relationships, you can forecast the impact of future business decisions with way more confidence. For instance, you could model how a planned $5,000 marketing budget for next quarter is likely to translate into actual revenue, turning your forecast from a simple guess into a powerful strategic planning tool.
Not everything sells every day. For a lot of e-commerce stores, a big chunk of the catalog is made up of intermittent demand items—products that sell sporadically, with long, quiet periods of zero sales in between. Think specialized replacement parts, high-end seasonal decorations, or niche hobbyist gear.
This is where traditional methods like moving averages completely fall apart. The constant zeros in the data skew the forecast, leading to predictions of near-zero demand. That's a perfect recipe for a stockout the moment a customer finally shows up to buy.
The Croston method is a clever technique designed specifically for this problem. It splits the forecasting process into two parts: predicting when a sale might happen and predicting the average size of that sale. By modeling these two things separately, it produces a much more realistic forecast for your slow-moving inventory.
This approach is crucial for preventing "dead stock" while still making sure you have those niche items on hand when a rare order finally comes through.
The real game-changers in modern forecasting are Machine Learning (ML) and Artificial Intelligence (AI). These systems can chew through massive, complex datasets to find subtle, non-linear patterns that are completely invisible to traditional statistical models. If causal models are detectives, then AI models are an entire forensics lab, processing thousands of data points at once.
ML algorithms don't just look at sales history; they can factor in dozens or even hundreds of variables, like:
One powerful statistical technique often folded into these advanced systems is the ARIMA (AutoRegressive Integrated Moving Average) model. For example, a major manufacturing company improved its forecast accuracy by 25% in one year by implementing ARIMA alongside regression models. By feeding in external factors like market trends and their own promotional activities, they slashed excess inventory by 18% and cut operational costs by about $1.2 million a year.
The real magic of AI is its ability to learn and adapt. As new data pours in, the model continuously refines its understanding of what drives demand, making its predictions better and better over time. This adaptive power is what makes modern AI-powered sales forecasting so effective for the fast-paced world of e-commerce. It turns forecasting from a static, periodic chore into a dynamic, intelligent system that grows right alongside your business.
Picking the right demand forecast method isn't about finding a single "best" option. It's about finding the best fit for each product's unique story. There's no such thing as a one-size-fits-all solution in forecasting. A method that works brilliantly for a stable, fast-moving bestseller will almost certainly fall flat when you apply it to a brand-new product with zero sales history.
Think of it like choosing the right tool for a job. You wouldn't use a sledgehammer for a delicate repair, and you wouldn't use a tiny screwdriver to build a deck. The whole game is matching the forecasting technique to the specific characteristics of the product you're trying to predict.
This decision really boils down to answering a few core questions about your products and your data.
First things first, you need to get a feel for your products. Grouping them based on their sales behavior and where they are in their market journey is the most logical starting point. Each category naturally points you toward a different family of forecasting methods.
The biggest mistake you can make in forecasting is mismatching the method and the data. Trying to run a complex time-series model on a product with only three weeks of sales data is a recipe for disaster. Always start by understanding the nature of the SKU itself.
Your historical data is the fuel for any quantitative forecast. The quality and depth of your sales information will either unlock powerful, advanced methods or limit you to simpler ones.
If you have two or more years of clean, reliable sales data, you can confidently use sophisticated models like ARIMA that can tease out yearly seasonality. On the other hand, if your data is limited or "noisy" with lots of random spikes and dips, a simpler approach like a Moving Average might actually be a more robust and reliable starting point.
This flowchart gives you a simple decision tree for navigating the more advanced models once you've confirmed you have enough quality data to work with.
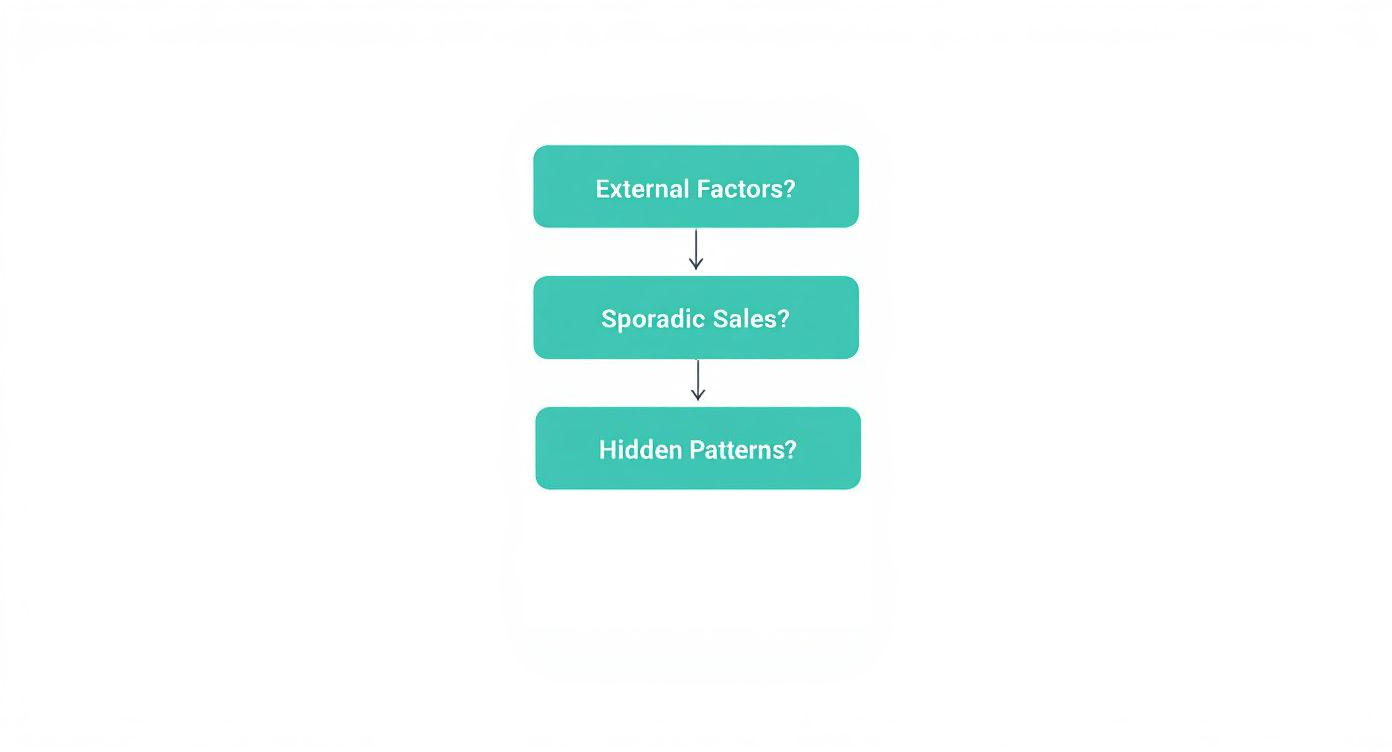
It helps you think through whether external factors, sporadic sales, or hidden patterns are the main drivers of demand for a particular SKU, guiding you toward the right tool for the job.
Ultimately, you need a flexible approach. A single store will almost always need to use multiple demand forecast methods across its catalog. Your top-selling T-shirt might get forecasted with ARIMA, a new seasonal candle with a qualitative approach, and a slow-moving accessory with the Croston method. That’s not just okay; it’s smart.
To make this practical, the table below breaks down which methods align best with common e-commerce product profiles. Think of this as your quick-start guide to matching the tool to the SKU.
| Product Profile (SKU Type) | Recommended Primary Method | Key Considerations | Example Product |
|---|---|---|---|
| Steady Bestsellers | Time-Series (e.g., ARIMA, Exponential Smoothing) | Requires at least 2 years of clean sales data to capture seasonality. Highly accurate for stable demand. | Classic white t-shirt, popular coffee blend |
| New Product Launches | Judgmental / Qualitative | No historical data exists. Use market research, expert opinion, or "look-alike" analysis from similar products. | A brand-new smartphone model, a first-run clothing line |
| Seasonal Stars | Time-Series with Seasonality (e.g., SARIMA) | Model must be able to identify and project recurring yearly patterns. Data history is crucial. | Holiday decorations, winter coats, swimwear |
| Slow & Sporadic Sellers | Intermittent Demand (e.g., Croston Method) | Standard models fail here. This method forecasts when a sale will happen and how much will be sold. | Replacement parts for appliances, luxury watches |
| Trendy / Hype Products | Causal / Machine Learning | Demand is driven by external factors (social media, ads). Models need to incorporate these external variables. | A viral TikTok gadget, a limited-edition sneaker drop |
This SKU-level thinking is the key. Instead of searching for one perfect model for your whole store, you apply the right model to the right products, creating a much more accurate and reliable overall forecast.
Making a strategic choice empowers you to move from just understanding the theory to actually applying it. Start by segmenting your products by their sales velocity and demand stability. A simple grouping like fast-movers, intermittent sellers, and new launches is a great place to start.
Once segmented, you can apply the most appropriate forecasting method to each group. This hybrid strategy ensures you're not forcing one model to do a job it wasn't designed for, which will dramatically improve your overall accuracy.
This targeted approach prevents the costly inventory mistakes—stockouts on your winners and overstocks on your duds—that come from using the wrong forecasting tool. It allows you to confidently manage stock levels, optimize cash flow, and ensure you have the right products ready for your customers when they need them. The goal is to build a forecasting system that is as diverse and dynamic as your product catalog.
Alright, let's move from theory to action. Knowing all the different demand forecasting methods is one thing, but making them work for your business is where the real value lies. An amazing forecast is just a number on a screen until you build a solid, repeatable process around it.
Execution is everything. It's the bridge between a prediction and a smart inventory decision that saves you money. This isn't a "set it and forget it" task; it's a living, breathing cycle of getting your data ready, testing your assumptions, and constantly fine-tuning your approach.
Think of it like building a high-performance engine for your e-commerce store. You can't just toss a bunch of parts in a box and expect it to roar to life. You have to carefully source the right components, clean every part, assemble them with precision, and then tune the engine to get every last drop of performance out of it.
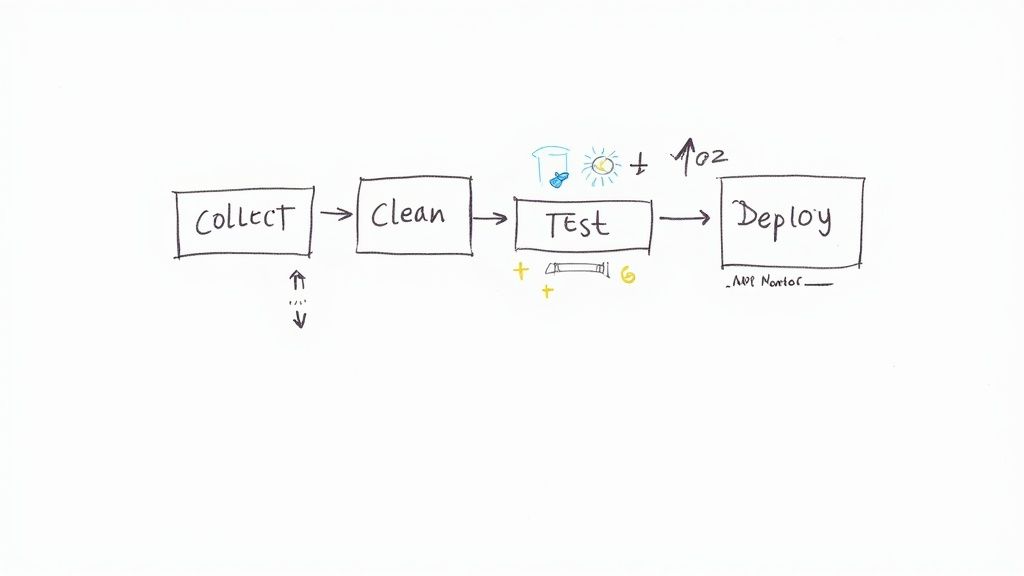
Let’s be brutally honest: your forecast will only ever be as good as the data you feed it. This is the most crucial step, and it's the one people are most tempted to rush. Trying to forecast with messy, incomplete data is like building a house on quicksand. It's going to collapse.
High-quality data is the absolute backbone of a reliable forecast. Before you even think about picking a model, you have to get your historical sales data in order.
This first stage is all about getting your hands dirty. It involves:
Once your data is clean, it's time to start auditioning forecasting models. As we've covered, there's no magic bullet—no single method works for everything. The right tool for the job depends entirely on the product's sales history and the data you have. The secret is to test several methods and see which one performs best for each specific SKU.
A powerful technique for this is backtesting. You essentially take a slice of your past data to "train" a model, then use the rest of that historical data to see how well it would have predicted what actually happened. You can then measure which model came closest to reality. For a deeper look at the metrics involved, check out our guide on how to measure demand forecasting accuracy.
The biggest mistake you can make here is adopting a "set it and forget it" mindset. Customer behavior shifts, new trends emerge, and the model that nailed it last quarter could be completely wrong this quarter. Constant monitoring isn't optional; it's essential.
Getting your forecast up and running isn't the finish line—it’s the starting gun. From here on out, it’s all about vigilance. You need to consistently compare what your forecast predicted with what actually sold.
When you start to see a growing gap between your predictions and reality, that's your warning sign. Something has changed, and your model is falling behind.
This is where the idea of adaptive forecasting really shines. Instead of being stuck with static models that go stale, modern tools like Tociny.ai use AI to build a system that learns and evolves on its own. These platforms can automatically spot shifts in demand patterns and tweak the underlying models for you, no manual intervention needed.
This kind of automated, adaptive system keeps you agile and accurate, even when the market gets chaotic. It frees you from having to become a full-time data scientist and ensures your inventory decisions are always based on the freshest, most relevant information possible.
Alright, even after breaking down all the different forecasting methods, you probably still have some questions floating around. Getting started with forecasting can feel like you're trying to drink from a firehose, but a few straightforward answers can make all the difference.
Let's cut through the noise and tackle the most common questions we hear from e-commerce merchants just like you. My goal here is to bridge that gap between the textbook theory and what you actually need to do in your store.
This is the classic "it depends" scenario, but there are some solid rules of thumb that will get you 90% of the way there. The amount of data you need really hinges on the forecasting model you choose and the natural sales cycle of your products.
For most time-series models like Exponential Smoothing or ARIMA, you want a minimum of two full business cycles. So, if your top-selling products see a big spike in the summer and a dip in the winter, you'll want at least two years of clean sales history. That gives the model enough runway to spot those recurring seasonal patterns and project them forward accurately.
But what if you’re launching a brand-new product or are just starting out? Don't panic. This is exactly where qualitative methods shine. With zero sales history, you can look at the performance of a similar "look-alike" product or dig into some market research to build a pretty solid initial forecast.
Heavier-duty machine learning models get hungry for data. They perform best with three to five years of history, which allows them to uncover much more subtle relationships and patterns that simpler models would miss.
This is a huge point of confusion, but the distinction is critical. Think of it this way: demand forecasting is the prediction, while demand planning is the action plan you build based on that prediction. They are two sides of the same coin, but they do very different jobs.
Demand Forecasting: This is the math-heavy part. It’s the analytical process of crunching data with statistical models to estimate what customers will want to buy. The output is a number, like, "We predict we’ll sell 500 units of SKU-123 next month."
Demand Planning: This is where strategy comes in. It takes that forecast and answers the question, "Okay, if we think we'll sell 500 units, what do we need to do right now?"
So, demand planning is all about making smart decisions: how much inventory to order, when to kick off a promotion, how to staff your warehouse, or when to schedule a production run. Forecasting gives you the numbers; planning tells you what to do with them to hit your goals.
The right rhythm for updating your forecasts comes down to your products and how wild your market is. There’s no magic number, but the key is to be consistent and ready to pivot.
If you’re selling fast-moving consumer goods (FMCG) or trendy items where demand can change on a dime, you should probably be looking at weekly or even daily forecast updates. Anything less, and you'll be constantly playing catch-up.
For more stable, established products with predictable sales, a monthly review and refresh is likely more than enough. You don't need to over-engineer it.
The most important habit to build is regularly checking your forecast accuracy. Pit your predictions against actual sales. This is where modern inventory systems are a game-changer, as they can automate this feedback loop and continuously fine-tune their own predictions without you lifting a finger.
Look, Excel is a fantastic tool for getting your feet wet. You can absolutely build simple demand forecast methods like a Moving Average or basic Exponential Smoothing in a spreadsheet. If you have a tiny store with just a handful of products, it can get the job done.
But let's be honest—Excel hits a wall, and it hits it hard. As soon as your business starts to grow, it becomes a massive bottleneck. Trying to forecast hundreds of SKUs, factor in marketing campaigns, or run anything more advanced than a simple average becomes a soul-crushing, error-prone nightmare. One broken formula can derail your entire inventory plan.
For any serious e-commerce store, moving to dedicated forecasting software isn't a luxury; it's a necessity. These platforms are purpose-built to handle the scale and complexity that spreadsheets just can't touch, saving you countless hours and preventing very expensive mistakes.
Ready to move beyond spreadsheets and guesswork? Tociny.ai uses adaptive AI to deliver precise, automated demand forecasts tailored to your Shopify store. See how you can reduce stockouts, eliminate overstock, and plan your inventory with confidence. Explore Tociny.ai today.
Tociny is in private beta — we’re onboarding a few select stores right now.
Book a short call to get early access and exclusive insights.