
To figure out your safety stock, one of the simplest and most effective starting points is the (Average Daily Sales × Safety Days) formula. This gives you a quick buffer based on how many extra days of sales you want to have on hand, just in case. It's a foundational step for preventing stockouts and keeping your customers happy.
Let's be honest—walking the tightrope between having too much stock and not enough is a constant headache for any e-commerce business. One side means tied-up cash and bloated carrying costs; the other leads to lost sales and frustrated customers. This is where mastering your safety stock calculation becomes a strategic advantage, not just another operational task.
Safety stock is the buffer inventory you hold to shield your business from two main headaches: unpredictable customer demand and unreliable supplier lead times. Think of it less as "just-in-case" inventory and more as a calculated insurance policy that keeps the lights on.
When a customer lands on a product page only to see "out of stock," the damage goes way beyond a single lost sale. One study found that when faced with a stockout, 37% of shoppers will buy from another brand, and 21% won't buy the item at all. That’s a huge chunk of your potential revenue walking right out the door, possibly for good.
A properly calculated safety stock directly addresses this by creating a much-needed cushion. It buys you time to react when a supplier's shipment is delayed by a week or when one of your products suddenly goes viral on social media. Without this buffer, you're constantly in a reactive, fire-fighting mode.
Before diving into complex formulas, it's crucial to understand the variables at play. The amount of safety stock you need isn't a one-size-fits-all number; it changes based on several key business factors.
Here's a quick look at the primary variables that determine how much safety stock any given product requires.
| Factor | Description | Impact on Safety Stock |
|---|---|---|
| Demand Variability | How much your daily or weekly sales fluctuate. Is demand steady or all over the place? | Higher variability means you need more safety stock. |
| Lead Time Variability | How consistent your suppliers are. Do shipments always arrive on time, or are delays common? | Longer or more unpredictable lead times require more safety stock. |
| Service Level Target | The percentage of customer orders you want to fulfill without a stockout (e.g., 95%, 99%). | A higher service level target demands more safety stock. |
| Forecast Accuracy | How good are you at predicting future sales? | Lower forecast accuracy means you'll need a larger safety stock buffer. |
| Product Value | The cost of the item. | High-value items may have lower safety stock to avoid tying up too much capital. |
| Supplier Reliability | The overall performance of your supplier, including order accuracy and quality. | Less reliable suppliers necessitate more safety stock. |
Understanding these factors is the first step. You can't just pick a number out of thin air; you have to tailor your buffer to the unique behavior of each product and supplier relationship.
The real power of understanding how to calculate safety stock lies in its ability to transform your operations and financial health. The benefits are clear and hit your bottom line directly:
At its core, safety stock isn't about hoarding inventory. It’s about strategically investing in stability to protect your revenue and reputation. It turns inventory management from a source of stress into a tool for growth.
For growing D2C brands, optimizing this buffer is crucial. Diving into detailed case studies on inventory analytics for D2C can reveal how data-driven decisions on stock levels lead to tangible business improvements. Ultimately, safety stock is the secret weapon that keeps your business running smoothly, no matter what surprises the market throws your way.
If you’re moving away from pure guesswork, you need a solid grasp of the basic formulas. These methods are perfect for businesses looking to formalize their inventory control without getting tangled up in heavy statistical modeling. They provide a reliable, straightforward way to figure out your safety stock.
Let's walk through two of the most common approaches: the simple 'Fixed Safety Stock' method and the more nuanced 'Average-Max' formula. We'll use a real-world scenario to make it all click.
Imagine you run an e-commerce store selling a popular brand of wireless headphones. You've noticed your supplier's delivery times can be all over the place, and you want a simple buffer to stop those dreaded stockouts.
The Fixed Safety Stock method is about as basic as it gets. You just pick a set number of units to always have in reserve. Often, this number comes from a gut feeling or a simple rule of thumb, like keeping two weeks of average sales on hand.
For instance, if you sell an average of 10 pairs of headphones per day, you might decide your safety stock should be 140 units (10 units/day × 14 days). It's incredibly easy to implement, but it has a massive blind spot: it completely ignores variability. This method treats every day and every shipment as perfectly average, which, as we all know, is rarely the case.
For a much more accurate picture, the Average-Max method is a huge step up. This formula forces you to consider the worst-case scenario by looking at the extremes of both your sales and your supplier lead times. It prepares you for those moments when sales unexpectedly spike right as your supplier is taking longer than usual to deliver.
This decision to hold a buffer is one of the most critical you'll make, as it directly ties to customer happiness and operational stability.
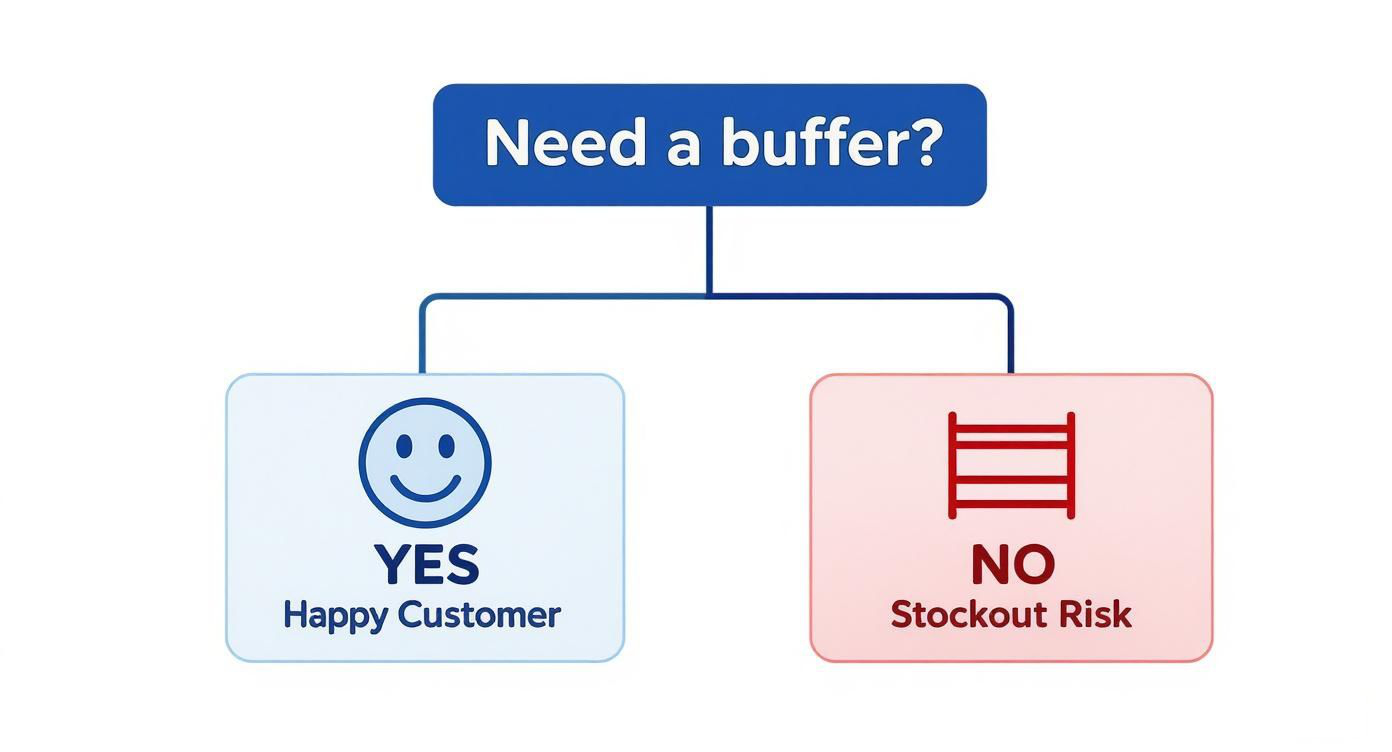
The simple flowchart above really nails the core trade-off. Investing in a buffer keeps customers happy, while skipping it puts you squarely in the path of stockouts.
Here's the Average-Max formula: (Maximum Lead Time × Maximum Sales) – (Average Lead Time × Average Sales)
Let's plug in the numbers for our wireless headphones example. After digging into the last six months of data, you've found:
Now, let's do the math.
First, figure out your worst-case consumption: Maximum Lead Time (12 days) × Maximum Sales (25 units) = 300 units
Next, calculate your average consumption: Average Lead Time (7 days) × Average Sales (10 units) = 70 units
Finally, find the difference: 300 units – 70 units = 230 units
Your new safety stock is 230 units. That’s quite a jump from the 140 units we got with the fixed method, but this number actually protects you from the combined chaos of peak demand and maximum delivery delays.
The beauty of this method is that it uses your own history to build a realistic buffer. It stops you from getting blindsided by the kind of volatility you should have seen coming.
While the Average-Max formula is powerful, its accuracy hinges entirely on good historical data. Solid sales figures are the direct result of understanding different demand forecasting methods, which lay the groundwork for these calculations. Ultimately, this approach gives you a balanced, data-informed buffer that's ideal for products with noticeable swings in sales and supplier reliability.
Once you've got the basics down, it’s time to level up. While simpler methods offer a decent starting point, statistical calculations are where you really start to dial in your inventory management with precision. This is about moving beyond simple averages and embracing a data-driven approach that accounts for the real-world chaos of demand spikes and supplier delays.
Think of it as shifting from a reactive stance—"Oh no, we're out of stock again!"—to a proactive strategy that puts your inventory investment exactly where it needs to be to hit your business goals. The most powerful tool for this job is often called the "King" formula. It might sound a bit complex at first, but it smartly combines the standard deviation of your lead time with your desired customer service level (represented by a Z-score). It's a game-changing way to quantify risk and build a buffer that’s truly tailored to each product.
At its heart, this statistical method helps you answer one of the most critical questions in e-commerce: "What percentage of the time do I want to be able to fulfill an order, even when things go wrong?"
That percentage is your service level.
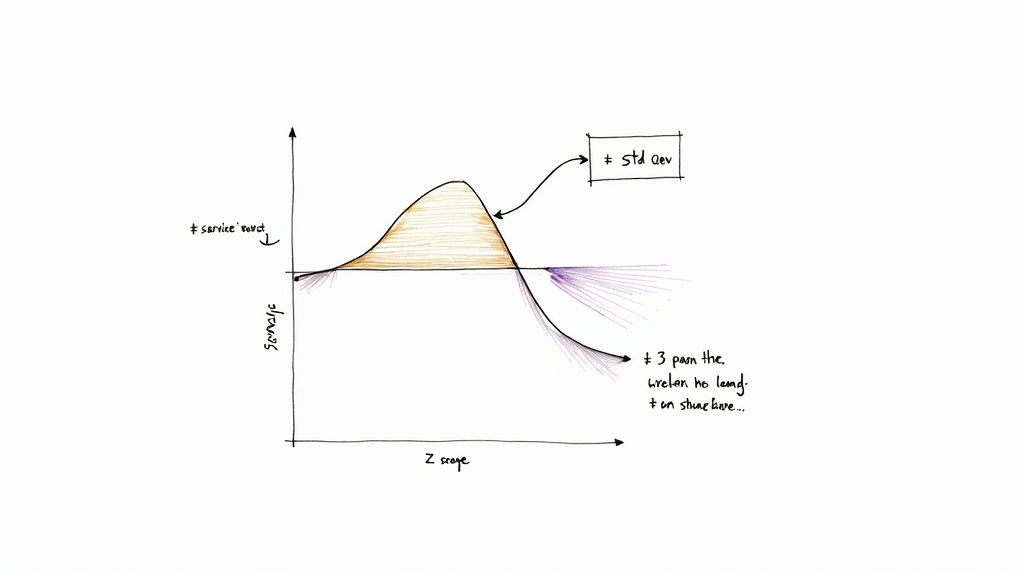
Setting a 95% service level isn't just a feel-good number. It's a strategic decision. It means you're aiming to have the right product on hand for 95 out of every 100 customer orders. The other 5% represents your accepted risk of stocking out. We then translate this target into a Z-score, which is just a statistical value that pins your service level onto a normal distribution curve (like the one above).
Choosing a service level is a balancing act between customer happiness and cash flow. A higher service level means happier customers but also more money tied up in inventory. This table breaks down what that trade-off looks like in the real world.
| Desired Service Level | Z-Score (Service Factor) | Impact on Inventory Level | Typical Use Case |
|---|---|---|---|
| 85% | 1.04 | Low | C-Class Items: Slow-moving products where a stockout is less critical. |
| 90% | 1.28 | Moderate | B-Class Items: Steady sellers where availability is important but not paramount. |
| 95% | 1.65 | High | A-Class Items: Bestsellers where stockouts lead to significant lost revenue. |
| 99% | 2.33 | Very High | Critical SKUs: High-margin products with loyal customers who expect availability. |
Notice the jump from a 95% to a 99% service level. The Z-score leaps from 1.65 to 2.33, which means you'll need to hold significantly more safety stock for that extra 4% of assurance. This is why picking the right service level is a huge financial decision, not just an operational one.
The formula, also known as the King formula, looks like this: Z × σLT × D-avg.
Let's break that down:
This isn't just theory. Companies that properly implement this have reported cutting their excess inventory by 20-30% while keeping customers happy. Plus, businesses using these statistical methods often see a 15-18% improvement in their inventory turns. You can find more practical insights on safety stock calculations on Extensiv.com.
Let’s walk through an example. Say you sell a popular skincare product with the following data:
First, we need the standard deviation of lead time (σLT). This number is crucial—it measures how much your supplier's delivery time actually varies. Looking at your last five shipments, the lead times were 8, 12, 10, 13, and 7 days. You can pop these into a standard deviation calculator or an Excel formula (=STDEV.S) to find that your σLT = 2.55 days.
Now you have everything you need. Let’s plug it all in:
Safety Stock = Z-score × Standard Deviation of Lead Time × Average Daily Demand Safety Stock = 1.65 × 2.55 days × 20 units/day Safety Stock = 84.15 units
We'll round that up to a clean 85 units. This is the exact buffer needed to hit your 95% service level, perfectly accounting for your supplier's typical delivery fluctuations.
This statistical method replaces guesswork with a precise calculation. It ensures you invest just enough capital to protect your most important promise to customers: having the product they want, when they want it.
When you start using this approach, you're no longer just stocking shelves; you're actively managing risk. Every number in that formula tells a story about your business—how fast you sell, how reliable your suppliers are, and how committed you are to your customers. It's a powerful way to make sure your inventory decisions are directly fueling your growth.
Static formulas are a great starting point, but let’s be honest—they can't keep up with the reality of a fast-moving e-commerce business. Market trends pivot, supplier performance hiccups, and demand for your products can surge or dive seemingly overnight.
To stay ahead, you need a method that adapts right along with your business. This is where a dynamic approach to safety stock really shines.
Instead of a "set it and forget it" number you might calculate quarterly, a dynamic model continuously adjusts your safety stock levels using the most current data. Think of it as a living, breathing calculation that responds in real-time to changes in both demand volatility and lead time uncertainty. This way, you’re not caught holding obsolete stock for a declining product or running out of a bestseller during an unexpected rush.
The engine behind this approach is a formula that elegantly accounts for the variability of both demand and lead time. It’s built on the understanding that uncertainty comes from two directions—your customers and your suppliers—and it calculates a buffer to protect against both at the same time.
Here it is: Safety Stock = Z × √((Avg LT × Std Dev of Demand)² + (Avg Demand × Std Dev of LT)²)
Let’s quickly break down the components:
This formula is widely considered the gold standard in modern inventory management. From what we've seen, companies that master these dynamic methods often slash their inventory investments by 25-35% while simultaneously boosting service levels by 5-10%. Even better, businesses that actively track forecast accuracy and adjust their safety stock can cut excess inventory by up to 30-40% compared to those using static models. You can dig deeper into how dynamic calculations drive smarter inventory decisions on gainsystems.com.
Let's run through a practical example. Imagine you sell a popular artisanal coffee blend on Shopify. After crunching the numbers from your store, here's what you've got:
First, we'll calculate the two main parts under the square root.
Part 1: Demand Variability During Lead Time (Avg LT × Std Dev of Demand)² = (8 days × 15 bags)² = 120² = 14,400
Part 2: Lead Time Variability Impact (Avg Demand × Std Dev of LT)² = (50 bags × 2 days)² = 100² = 10,000
Now, we add them together and find the square root: √(14,400 + 10,000) = √24,400 ≈ 156.2
Finally, multiply by your Z-score to lock in the safety stock level: 1.65 × 156.2 = 257.73 bags
We’d round that up to 258 bags. This isn't just a guess; it's a precise, dynamic buffer, scientifically calculated to protect your business from the combined risks of fluctuating sales and unpredictable supplier deliveries.
This method creates an intelligent buffer that expands for volatile products with unreliable suppliers and shrinks for stable items with consistent fulfillment. It's the definition of working smarter, not just holding more.
While you could technically wrestle with this formula in a spreadsheet, its real power is unlocked through automation. The whole point of a dynamic system is to recalculate these levels frequently—weekly or even daily—as fresh sales and delivery data rolls in. Trying to manage that manually for more than a handful of SKUs is a recipe for headaches.
This is exactly what modern inventory platforms like Tociny.ai are built for. By connecting directly to your Shopify data, these tools handle all the heavy lifting for you. They can:
This kind of technology makes sophisticated inventory management accessible to everyone. It lets you run a truly responsive supply chain, ensuring your capital is always invested in the right products at the right time, ultimately maximizing both profit and customer happiness.
Figuring out your safety stock is a huge win, but that number is useless if it just sits in a spreadsheet. You have to put it to work. This is where the reorder point (ROP) comes into play, creating a direct link between your safety buffer and your actual purchasing process.
The ROP is simply the inventory level that triggers a new purchase order.
Think of it like the low-fuel light in your car. You don’t wait until the tank is bone dry to find a gas station. That light flicks on when you still have a reserve—your safety stock—giving you plenty of time to refuel before you’re stranded. Your reorder point does the exact same thing for your products.
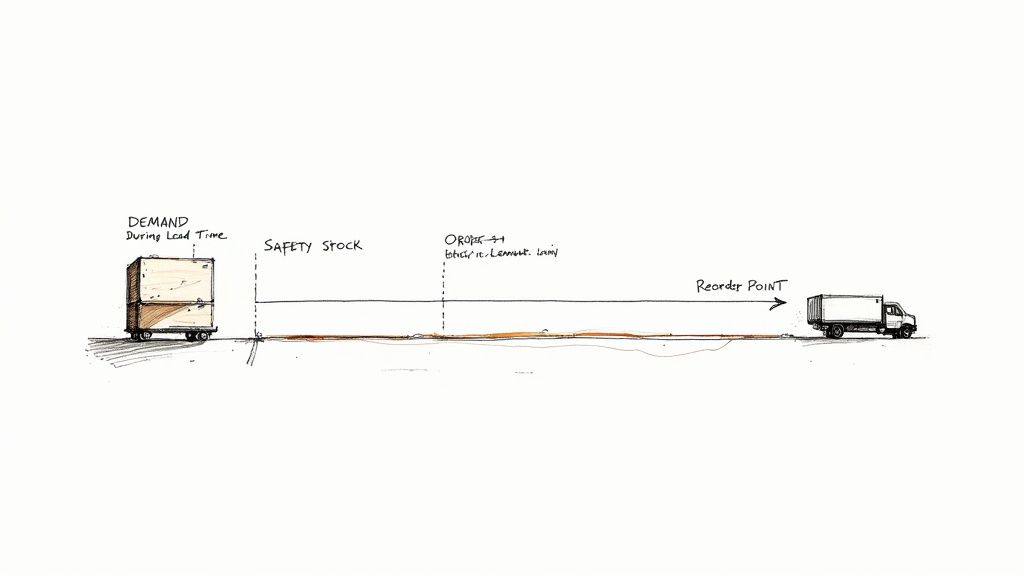
The formula itself is refreshingly straightforward, but it’s powerful because it ties together your sales forecast, supplier lead times, and the safety stock you just worked so hard to calculate.
Reorder Point = (Average Daily Sales × Average Lead Time in Days) + Safety Stock
The first half of that equation, (Average Daily Sales × Average Lead Time), is your demand during the replenishment window. It’s the stock you fully expect to sell while you're waiting for the new shipment to arrive. The safety stock is then tacked on as your insurance policy against surprise sales spikes or shipping delays.
Let’s plug in some numbers for two very different products to see how this works in the real world.
Scenario 1: The Steady Bestseller
Remember those wireless headphones from earlier? We landed on a safety stock of 230 units. Let's assume a few other things:
Plugging these into the formula, we get:
ROP = (10 units/day × 7 days) + 230 units ROP = 70 units + 230 units = 300 units
This tells you that the moment your on-hand inventory for these headphones hits 300 units, it's time to generate a PO. By the time that new order shows up, you’ll have likely sold through the 70 units of regular stock and will only have dipped into your safety buffer if something unexpected happened.
Scenario 2: The Unpredictable, Low-Volume Item
Now for a completely different product: a specialty phone case that sells erratically.
Let's find the ROP for this one:
ROP = (2 units/day × 15 days) + 45 units ROP = 30 units + 45 units = 75 units
For this case, the trigger to reorder is 75 units. Notice how the higher safety stock and longer lead time create a reorder point that's proportionally much larger compared to its sales volume. That's the formula doing its job, properly buffering against the higher uncertainty of this particular SKU.
Once you've calculated these ROPs, they need to be set up in your inventory management system. It doesn't matter if you're using a simple spreadsheet with conditional formatting or a sophisticated platform; the goal is an automatic alert when a SKU hits its reorder point.
This proactive trigger is what stops stockouts in their tracks and saves you from placing those expensive, last-minute rush orders. To learn more about making this part of your workflow seamless, check out how to manage purchase orders efficiently.
Finally, don't just set it and forget it. Reorder points are living numbers. Market trends shift, suppliers change their lead times, and sales promotions can throw a wrench in your forecasts. All these factors can make your old ROP obsolete. A quarterly review is a great place to start to make sure your inventory triggers are still dialed in to the reality of your business.
Once you’ve got the formulas down, the real-world questions start popping up. Moving from a spreadsheet to a confident inventory strategy means understanding the nuances that pure math doesn't always capture. This is where we get into the "what ifs" that inevitably arise when you start refining how you calculate safety stock for your business.
Let's dive into the practical side of things and answer the questions inventory managers ask when the data starts rolling in and it’s time to make a call.
There’s no magic number here. The best rule of thumb is to match your recalculation frequency to your product's volatility. The more a product's demand or lead time jumps around, the more often you need to check in.
For your fastest-moving items or products with heavy seasonality, a monthly or quarterly review is a smart move. This keeps your buffer from getting stale and ensures it reflects what’s happening in the market right now. For your more stable, predictable products, a semi-annual or even annual check-in might be perfectly fine.
But here’s the real tell: your performance. If you start seeing more stockouts on a specific SKU or notice its inventory value is creeping up for no good reason, it’s time to recalculate, period. Don't wait for the calendar to tell you what to do; let your performance metrics be your guide.
This is a strategic business decision, not a number you pull from a textbook. The smartest way to tackle this is by segmenting your inventory, usually with an ABC analysis. Not every product deserves the same level of protection because not every product drives the same value.
Here’s a practical framework to get you started:
Setting service levels is an active financial decision. It's about deliberately allocating your working capital to protect the SKUs that matter most to your bottom line and your brand's reputation.
Absolutely. When you're starting out or have a small, manageable catalog, Excel is a fantastic tool for getting your head around the formulas. You can easily use built-in functions like AVERAGE for mean demand and STDEV.S to figure out standard deviation.
But be warned: as your business grows, this manual process will become a major operational bottleneck. Trying to manage dozens, let alone hundreds, of SKUs in a spreadsheet is not just time-consuming; it's dangerously prone to human error. A single copy-paste mistake can throw off your entire purchasing plan for the quarter.
The moment you find yourself spending hours every week just updating spreadsheets, that's your sign. You’ve outgrown it. Upgrading to a dedicated inventory management platform will save you an immense amount of time and deliver far more accurate, automated results.
Launching a new product is exciting, but from an inventory perspective, it’s a bit of a guessing game. You have zero historical sales data to work with. Without that track record, you have to get creative.
Your best bet is to find a "proxy" product in your current catalog. Look for an existing item with similar characteristics—maybe it has a similar price point, target audience, or use case. Use its sales data as your initial baseline to get started.
If you don't have a good comparison, you'll have to lean on market research, competitor analysis, or even pre-launch survey data to build a forecast. When in doubt, it’s always wise to err on the side of caution and start with a slightly higher safety stock level. Then, for the first few months, you need to watch its sales like a hawk. Be ready to adjust your safety stock levels quickly and often as real demand patterns start to emerge.
Ready to move beyond manual calculations and endless spreadsheets? Tociny.ai uses AI to automatically analyze your sales data, predict future demand, and recommend the optimal safety stock for every single one of your products. Stop guessing and start making data-driven inventory decisions that boost your bottom line. Explore Tociny.ai today.
Tociny is in private beta — we’re onboarding a few select stores right now.
Book a short call to get early access and exclusive insights.