
To really get a handle on slow-moving inventory, you have to dig into the right performance metrics. I’m talking about inventory turnover, sell-through rate, and days of inventory on hand. These numbers tell the true story of which products are tying up your cash and hogging precious warehouse space. Nail this, and you can take action before they become a serious financial drain.
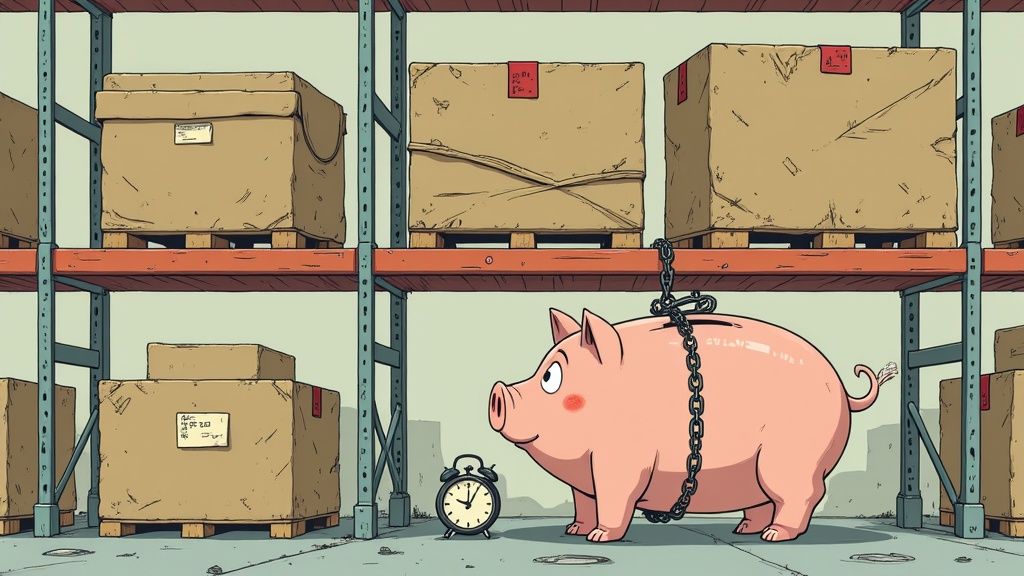
Slow-moving inventory is so much more than a storage problem—it's a silent profit killer, quietly chipping away at your business's financial health. Before we jump into the formulas and reports, it's critical to understand why flagging these stagnant products is a top priority. The fallout goes way beyond a monthly warehousing bill.
Every single dollar tied up in a product that isn't selling is a dollar you can't put back into your business. That's cash you could be using for a winning marketing campaign, developing your next bestseller, or doubling down on top-performing SKUs that actually drive growth. This financial paralysis is one of the biggest hidden costs of letting your inventory management slide.
Think of your slow-moving stock as an unofficial, recurring tax on your business. It piles on costs every single day through a bunch of channels that are easy to ignore until they snowball into a major problem.
The real danger of slow-moving inventory isn't just the space it occupies, but the growth it prevents. It forces you to manage the past instead of investing in the future.
Ultimately, grasping these financial stakes is what provides the motivation to learn how to identify slow moving inventory before it gets out of hand. It shifts the task from a boring, routine check-up into a critical business strategy for staying profitable and agile.
You can't flag slow-moving inventory if you haven’t defined what "fast" looks like for your business. Just grabbing a number out of thin air, like 90 days, is a quick way to misread your own data. The real goal here is to build a realistic, customized framework that actually reflects how your products should perform.
Let's be honest, not all products are created equal. Context is everything.
A winter coat sitting on the shelf in July is completely normal. But a core, evergreen t-shirt that hasn't sold in three months? That's a different story. Applying the same velocity threshold to both would lead to terrible decisions, like panic-discounting a seasonal bestseller right before its peak season.
To build benchmarks that are actually useful, you need to segment your inventory. Start by grouping products based on their expected sales patterns. This simple step immediately brings a ton of clarity to your performance analysis.
Core Products: These are your year-round staples, the bread and butter of your store. They should have a relatively high and consistent sales velocity. If one of these hasn't moved in 60-90 days, it’s time to investigate.
Seasonal Products: For items like holiday decor or summer apparel, you have to look at their performance within a specific selling window. A winter jacket that's still in stock by March is a problem. That same jacket sitting there in June? Not a big deal.
High-Value or Luxury Items: Big-ticket products naturally move slower. It’s just not reasonable to expect a $2,000 handbag to fly off the shelves as quickly as a $20 candle. For these, a threshold of 180 days or even a full year might be perfectly appropriate.
Setting category-specific benchmarks is the bedrock of good inventory analysis. It stops you from mislabeling profitable seasonal items as losers and helps you focus on the products that are genuinely tying up your cash.
While your own data is king, it helps to see how you stack up against the competition. Slow-moving inventory is a massive headache for retailers, often accounting for 10% to 40% of total stock.
A key metric to watch is the inventory turnover ratio, which tells you how many times your inventory is sold and replaced over a year. A common rule of thumb is that a turnover ratio below 4 to 6 signals slow movement, but this varies wildly by industry. A grocer might see anything unsold after 30 days as slow, while a furniture retailer might not bat an eye until after six months. This RedStag Fulfillment analysis offers some great industry-specific insights.
Getting familiar with metrics like Days Inventory Outstanding (DIO) is also essential for setting these time-based thresholds. Dive deeper into this by checking out our guide on calculating Days Inventory Outstanding to really nail down your benchmarks. By setting these clear, measurable goals upfront, you create a reliable system to spot the real underperformers before they become a major drain on your business.
Once you’ve set your goals and timeframes, it’s time to get your hands dirty with the data. Relying on a gut feeling for what’s selling (and what’s not) is a recipe for disaster. The numbers, however, never lie.
Getting comfortable with a few key formulas is the fastest way to turn raw sales data into a clear, objective picture of your inventory’s health. These metrics are your diagnostic tools. They don't just tell you if a product is slow-moving; they reveal the severity of the problem, allowing you to make smart, profitable decisions instead of just guessing.
To get started, you'll want a quick reference for the most important formulas. This table breaks down the metrics we're about to cover, explaining what they measure and what the results actually mean for your business.
| Metric | Formula | What It Measures | Good vs. Bad Signal |
|---|---|---|---|
| Inventory Turnover | COGS / Average Inventory | How many times you sell and replace your entire inventory in a period. | Good: High ratio (e.g., 4-6). Bad: Low ratio (e.g., below 2). |
| Sell-Through Rate | (Units Sold / Units Received) x 100 | The percentage of stock sold versus what you brought in during a period. | Good: High percentage (e.g., >80%). Bad: Low percentage (e.g., <40%). |
| Days of Inventory | (Average Inventory / COGS) x 365 | How many days it takes, on average, to sell through your entire inventory. | Good: Low number of days. Bad: High number of days. |
Think of these metrics as the vital signs for your inventory. Monitoring them regularly is the first step toward proactive, data-driven management.
First up is the Inventory Turnover Ratio. This is the gold standard for measuring how efficiently you’re cycling through your stock. It answers a simple question: How many times did you sell out and restock your entire inventory over a specific period, usually a year?
A high turnover ratio almost always points to strong sales and lean operations. On the flip side, a low ratio is a classic red flag for slow-moving products, signaling that you’ve either overbought or customer demand has fizzled out.
The formula is pretty straightforward:
Let's say your annual COGS is $200,000 and your average inventory value is $50,000. Your turnover ratio is 4. That means you sold through your entire inventory four times last year. To play with your own numbers, check out this handy inventory turnover ratio calculator and guide here.
While turnover gives you that big-picture view, the Sell-Through Rate zooms in for a more product-level insight. It calculates the percentage of units sold compared to the number of units you received from your supplier in a given timeframe—usually a month.
This metric is incredibly useful for judging the launch of a new product or measuring how well a marketing campaign landed. It asks, "Of all the stock we brought in, how much did we actually sell?"
Here’s the calculation:
Imagine you ordered 200 units of a new skincare serum and sold 50 in the first month. Your sell-through rate is (50 / 200) x 100 = 25%. A consistently low rate on a product is a strong indicator of poor product-market fit or an advertising message that just isn't connecting.
A low sell-through rate is an early warning system. It tells you a product isn't resonating with customers long before it starts dragging down your overall turnover ratio.
Finally, Days of Inventory on Hand (DSI)—sometimes called Days Sales of Inventory—translates your turnover ratio into something more tangible: how many days it actually takes to sell through your stock. This is a critical metric for managing your cash flow.
A high DSI means your cash is trapped on your shelves for longer, which can put a serious strain on your finances. The goal is to keep this number as low as you can without running into stockouts.
The formula builds directly on your turnover ratio:
Using our earlier example, with $50,000 in average inventory and $200,000 in COGS, your DSI is (50,000 / 200,000) x 365 = 91.25 days. That tells you it takes, on average, about three months to clear your inventory. Calculating these three metrics consistently gives you a solid framework for identifying slow-moving inventory with confidence.
Alright, with the key metrics under our belt, it's time to roll up our sleeves and put that theory into practice. Your Shopify admin is a goldmine of data, but honestly, knowing where to dig is half the battle. Let's walk through exactly how to use Shopify's own reports to pinpoint the products that are quietly bleeding your profits dry.
The two most powerful native reports for this job are the ‘ABC analysis by product’ and the ‘Product sell-through rate’ report. These aren't just fancy dashboards; they translate the formulas we just talked about into actionable insights. This is where you connect the dots, turning abstract numbers into a concrete hit list of underperforming inventory.
You'll find both reports by heading to Analytics > Reports in your Shopify admin. Once you're there, you'll see a whole menu of sales reports, each offering a different angle on your product performance.
Here's where to focus:
ABC Analysis by Product: This is your first stop for a high-level overview. Shopify automatically grades your products from 'A' (your bestsellers) down to 'C' (your laggards) based on how much revenue they've generated in the last 28 days. Those C-grade products? They're your prime suspects for slow-moving stock.
Product Sell-Through Rate: This report gets much more granular. It shows you the exact percentage of stock sold for every product over a time period you choose. A consistently low sell-through rate is a massive red flag that a product just isn't resonating with customers.
This simple workflow is the core of the process: collect the data, run the numbers, and then analyze what it all means.
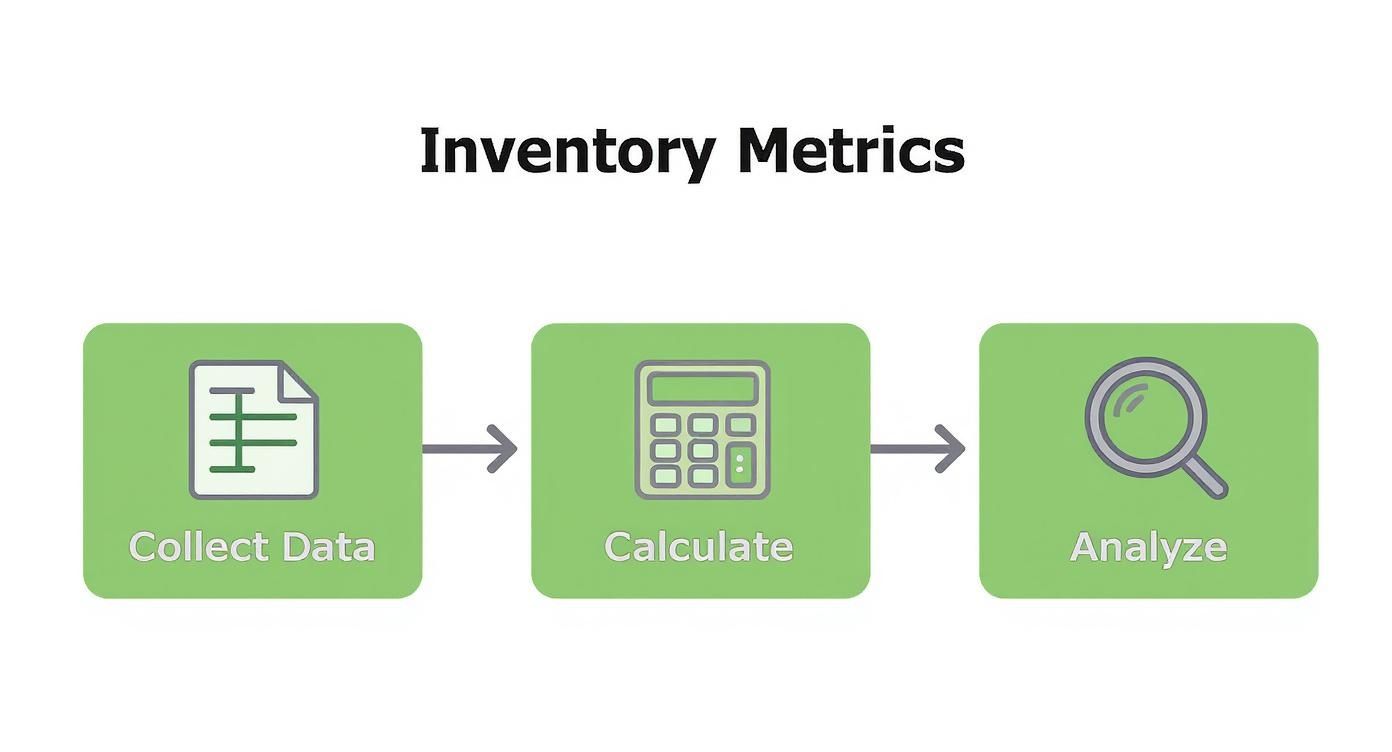
The real takeaway here is that identifying slow movers isn't a one-and-done task. It's an ongoing cycle of gathering data and interpreting what it's telling you.
Finding the reports is the easy part. The real magic happens when you start interpreting the data. When you open that ABC analysis, don't just glance at the C-grade items and call it a day—you have to dig deeper.
I always recommend exporting the data to a spreadsheet. From there, you can compare it against your sell-through rates for the last 90 or 180 days. For an even more sophisticated look, our guide on ABC-XYZ analysis for Shopify adds another layer to this review, factoring in demand volatility.
One of the biggest culprits behind slow-moving stock is simply a bad forecast. When items have irregular demand, it's easy to over-order "just in case." Research from MIT shows that mismatches between forecasted and actual sales can create negative variances of 25% to 30%—a classic symptom of stagnant inventory.
Use the date filter aggressively. Compare this quarter's sell-through rate to the same quarter last year. This simple step helps you distinguish between a truly slow product and a seasonal item that's just in its off-season.
By cross-referencing these two reports and filtering by relevant timeframes, you build an undeniable case for which products need immediate attention. You're no longer guessing. You're making data-driven decisions based on your store's actual performance, turning abstract metrics into a targeted list of underperformers ready for action.
Let's be honest, manually digging through Shopify reports every month is a grind. It’s a reactive process that just doesn't work once your business starts to grow. By the time you flag a product as a "C-grade" item, it’s probably been quietly draining your cash for weeks, if not months. This is where you can flip the script entirely—moving from playing catch-up to making sharp, proactive decisions.
Modern analytics tools, like Tociny.ai, plug right into your sales channels and do all the heavy lifting. Instead of you having to hunt for insights, these platforms bring them right to you. They comb through your historical sales data and use predictive models to spot underperforming SKUs before they become a real problem.
The real magic of automation is its ability to keep a constant eye on your inventory health. Forget about waiting for your end-of-month review. You can get an alert the moment a product’s sales velocity dips below a threshold you’ve set yourself.
This proactive approach is more critical than ever. The supply chain chaos we've seen since the pandemic has made managing stock levels a nightmare. A recent benchmark report found that even though small businesses cut their total inventory by 9%, a staggering 80% are still stuck with slow-moving items. It's all down to unpredictable lead times and wild swings in demand. You can get the full scoop on these inventory management challenges in this report.
A good analytics platform lets you build a custom dashboard that tracks the KPIs that actually matter to your business. That means no more exporting spreadsheets or punching numbers into a calculator.
Automation isn't here to replace your gut feeling; it's here to supercharge it. It frees you from the drudgery of data collection so you can spend your time on what really matters: making smart, strategic decisions that grow your business.
By putting these automated systems in place, you’re fundamentally changing how you identify slow moving inventory. It stops being a monthly chore and becomes a continuous, background process. No underperforming product can hide for long, giving you the power to act quickly and confidently.
Once you've crunched the numbers and pinpointed your slow-moving inventory, it's time to act. Just letting those products sit on a shelf is like setting cash on fire. A smart, proactive strategy not only gets your capital back but also clears precious warehouse (and digital) space for products that actually sell.

The real goal isn't just to dump stock. It's about doing it intelligently to minimize the hit to your margins and, just as importantly, protect your brand's reputation. A huge flash sale might move units, but if you do it too often, you'll just train your customers to wait for discounts, devaluing everything you sell.
Don't just jump to a clearance sale. Get creative. A classic tactic that still works wonders is bundling a slow-mover with one of your bestsellers. This bumps up the perceived value of the whole cart and helps you offload the less popular item without having to slash its price.
Here are a couple of other powerful strategies I've seen work well:
These tactics reframe the slow-mover as a cool bonus, not an unwanted dud. This preserves its value in the customer's mind while still getting it out of your warehouse.
Your response to slow-moving inventory should be a scalpel, not a sledgehammer. Strategic promotions protect your brand's integrity, while a constant cycle of clearance sales erodes it.
Let's be honest: sometimes, no amount of clever marketing can save a product. If an item has consistently terrible sell-through rates and has been sitting for over 180 days even after you've tried promoting it, it’s time to get serious.
At this point, liquidating through a third-party seller or even donating the stock for a tax write-off can be the smartest financial move you can make. It stings, but it stops the bleeding.
The most important part? Learn from it. Every slow-mover is a data point telling you what your customers don't want. Feed these insights back into your purchasing and forecasting process to finally break the cycle of overstocking.
Even with a solid game plan, you're bound to run into some specific questions once you start digging into your inventory data. Let's get them answered now so you can move from analysis to action without hesitation.
For most stores, a monthly inventory review is the sweet spot. It's frequent enough to catch problems before they snowball into a major cash flow issue, but not so often that it becomes a chore.
That said, if you're in a fast-paced niche like fashion or deal with highly seasonal goods, you'll want to tighten up that timeline. During your peak selling seasons, it's smart to do a check-in every other week, or even weekly. This keeps you agile and ready to pivot on a dime.
Absolutely. This happens all the time, and the most common culprit is seasonality. A heavy winter coat is obviously going to be a slow-mover in July, but it's a critical part of your Q4 sales strategy. It's not a bad product, it's just off-season.
The key is to always analyze performance within the right context. For seasonal items, you should be comparing sales data year-over-year, not month-over-month.
If a product consistently tanks during its prime selling season for two years in a row, that's a much stronger sign that it might be time to cut it loose for good.
Getting this distinction right is crucial because it dictates your next move. They aren't the same thing.
Tired of drowning in spreadsheets? Tociny.ai uses AI to automatically flag your slow-moving products, predict future demand, and give you clear, actionable recommendations to protect your profits. Get early access and see how much faster you can grow at https://tociny.ai.
Tociny is in private beta — we’re onboarding a few select stores right now.
Book a short call to get early access and exclusive insights.