An inventory turnover ratio calculator is a simple tool, but the metric it spits out is incredibly powerful. It tells you exactly how many times you sell through and restock your entire inventory in a given period. Think of it as a clear, no-nonsense indicator of how well your sales and inventory management are working together.
It’s easy to write off "inventory turnover ratio" as just another bit of accounting jargon. But for any ecommerce business, this one number is one of the most honest health checks you can perform. It cuts right through the noise to tell you how efficiently you’re turning your products into cash.
I like to think of it as your business's pulse.
A strong, steady pulse? That signals healthy sales and smart inventory decisions. A weak or erratic one, on the other hand, can point to some serious underlying issues. These problems usually show up as:
Getting a handle on this ratio isn't just a theoretical exercise; it directly impacts your financial health and your ability to pivot quickly. A low turnover rate means you're bleeding money on carrying costs—things like storage fees, insurance, and potential spoilage—for products that aren't making you a dime. That eats directly into your profit margins.
Conversely, a well-managed turnover ratio keeps your inventory lean. This frees up cash flow and ensures the products you’re selling are fresh and in demand. It’s the clearest way to see which products are your superstars and which ones are just dead weight.
A healthy inventory turnover ratio is the bedrock of a financially sound retail operation. It ensures your capital is actively generating revenue, not just passively collecting dust in a warehouse.
The market shifts we saw post-pandemic are a perfect, if painful, lesson in why this matters. Between 2020 and 2021, the average turnover rate for ecommerce brands plunged by 22% as supply chains got chaotic and customer behavior went haywire. It got even worse in the first half of 2022, with a staggering 46.5% drop from 2021 levels. This data, which you can dive into deeper in these inventory turnover trends on ShipBob.com, shows just how dangerous overstocking can be in a volatile market.
Failing to adapt can crush your profitability. By mastering this metric, you give yourself the insight to navigate that kind of uncertainty and make smart, proactive decisions that lead to sustainable growth.
Getting your hands dirty with the numbers is less intimidating than it sounds. The inventory turnover formula is surprisingly straightforward, but you need to get its two core components right: your Cost of Goods Sold and your Average Inventory. An accurate result depends on it.
Let's break down exactly how to find these numbers and plug them in.
The basic formula is simple:
Inventory Turnover Ratio = Cost of Goods Sold (COGS) / Average Inventory
This little equation tells you how many times your business sold and replaced its entire stock over a specific period. Think of it as your inventory's refresh rate.
First up is your Cost of Goods Sold (COGS). This number represents all the direct costs tied to producing or acquiring the products you've sold. In short, it’s the wholesale price of everything that walked out your door.
Crucially, this number includes costs like:
It's just as important to know what COGS doesn't include. You’ll want to exclude indirect costs like your marketing spend, sales team salaries, or that Shopify subscription fee. Those are operational expenses, not direct product costs. For most Shopify merchants, you can find your COGS right on your income statement or profit and loss (P&L) report.
Next, you need your Average Inventory. You might be tempted to just grab the inventory value from a single day, but that can give you a really skewed picture. A snapshot taken during a Black Friday sales rush or right after a massive restock won't reflect your typical inventory levels at all.
Using an average smooths out those peaks and valleys, giving you a much more reliable figure to work with.
To get it, just use this formula:
Average Inventory = (Beginning Inventory + Ending Inventory) / 2
Take the value of your inventory at the very start of your chosen period (say, January 1st) and add it to the value at the very end (like December 31st). Then, just divide by two. This gives you a balanced view of the stock you held throughout the year.
Pro Tip: If your business is highly seasonal, calculating the average inventory on a quarterly or even monthly basis will give you an even more precise turnover ratio. The more data points you use for your average, the more accurate your final calculation will be.
Let's put this into practice with a real-world scenario. Imagine you run an online boutique selling handcrafted leather bags.
You pull up your books for the last year and find these numbers:
First, let's calculate your average inventory:
Now, we can plug our COGS and Average Inventory into the main formula:
Boom. Your inventory turnover ratio is 5. This means your boutique sold through its entire stock of bags five times over the course of the year. This number is your starting point for a much deeper analysis. From here, you can also figure out how long your stock typically sits before selling. For more on that, check out our guide on calculating Days Inventory Outstanding.
This whole process is about how inventory moves through your business, turning from stock into sales and, finally, into cash in the bank.
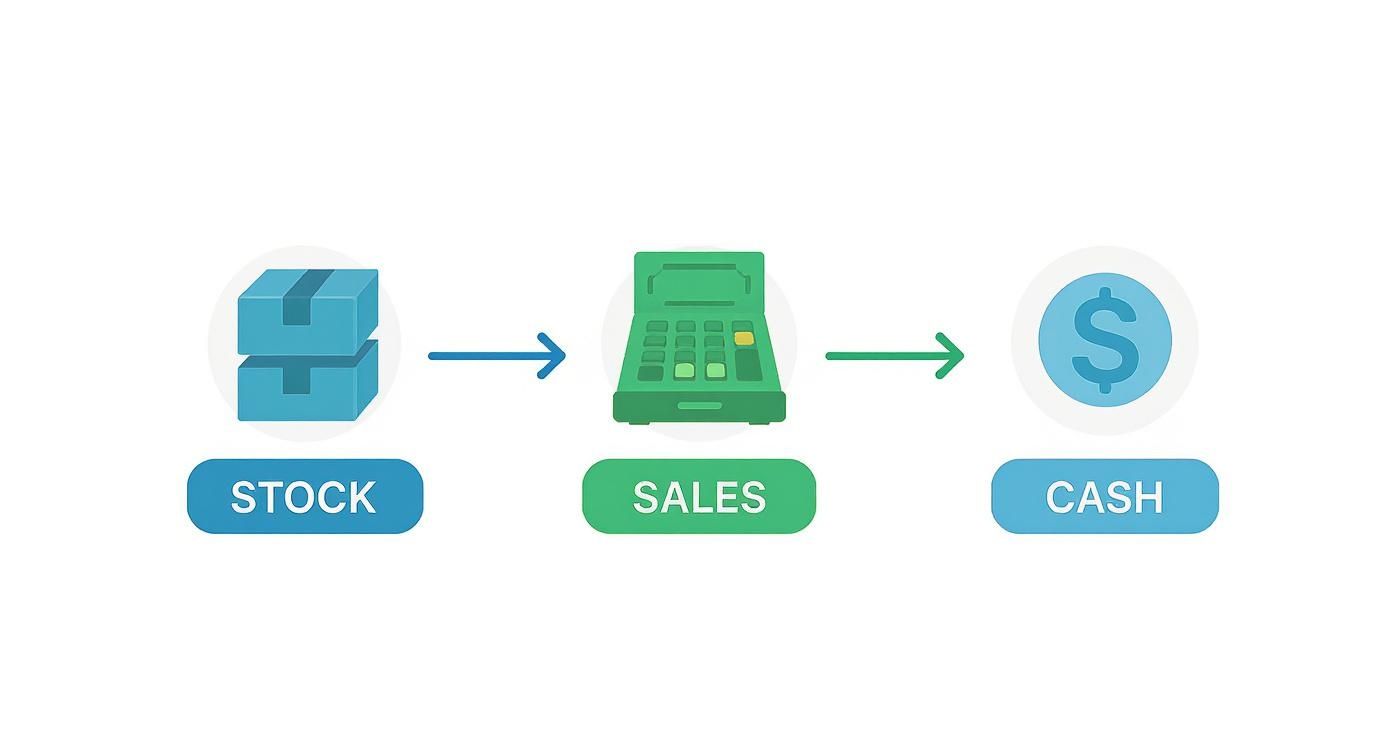
As you can see, a faster cycle from stock to cash is the goal, and that’s precisely what a healthy turnover ratio shows. With these simple steps, you can confidently calculate a clear, actionable metric for your business's health.
So, you’ve plugged your numbers into an inventory turnover ratio calculator and have a result staring back at you. Now what? It's easy to think "high is good, low is bad," but in the real world of e-commerce, it’s never that simple. A truly “good” ratio isn’t some universal number; it’s a moving target that depends entirely on what you sell, your business model, and the industry you operate in.
Think of it this way. A high ratio might mean you’re a sales powerhouse, flying through products. But it could also be a red flag. Are you constantly teetering on the edge of a stockout, frustrating customers who can't find their favorite items?
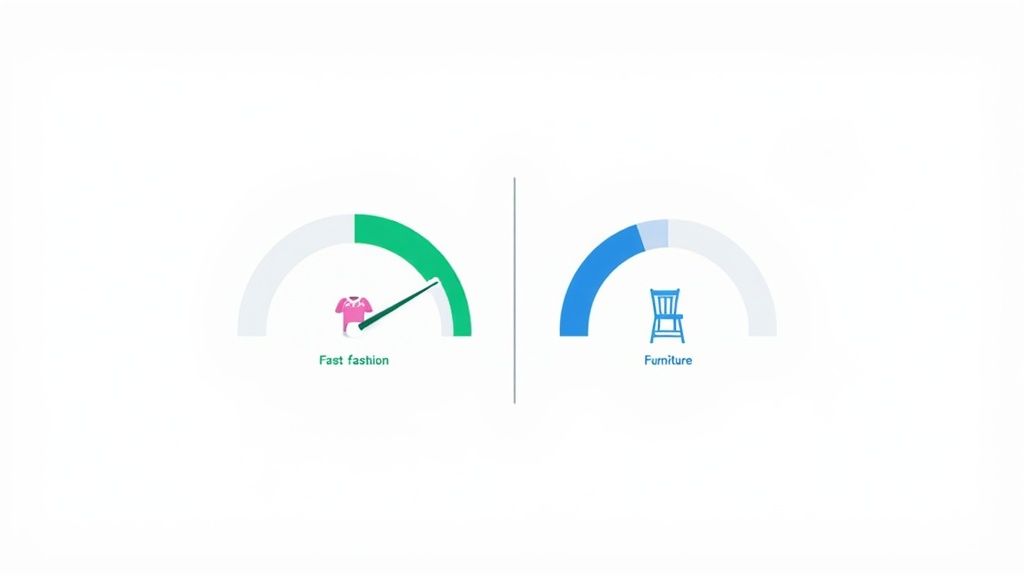
On the flip side, a low ratio often signals inventory bloat. That means your cash is literally frozen on your shelves, tied up in slow-moving products that are costing you money in storage and insurance every single day. A fast-fashion brand needs a completely different turnover speed than a boutique selling custom furniture. Context is everything.
To get a real sense of your performance, you have to compare apples to apples. Stacking your ratio against industry averages gives you a realistic baseline and helps you set goals that actually make sense for your business.
For example, the average turnover rate across all industries is around 8.5, but that number hides a massive range. The financial sector can see rates over 227, while businesses selling heavy industrial goods might hover around 2.67. For retail, the average is closer to 11.32. You can learn more about these different benchmarks in this deep dive into inventory statistics on UnleashedSoftware.com.
Judging your Shopify store against a generic "good" ratio is a recipe for bad decisions. Your real goal is to understand where you fit in your specific niche.
The most valuable comparison isn't against some abstract ideal. It's against your direct competitors and, more importantly, your own past performance. A steady upward trend in your ratio, month over month, is a powerful sign of improving operational health.
To put this into perspective, here’s a look at how different industries stack up and why their turnover rates vary so much.
This table compares typical inventory turnover ratios across different sectors. Use it to benchmark your own performance and understand the unique demands of your market.
| Industry Sector | Average Inventory Turnover Ratio |
|---|---|
| Grocery & Food | 15 - 30+ |
| Fast Fashion | 8 - 12 |
| Consumer Electronics | 8 - 10 |
| Home Furnishings | 3 - 5 |
| Luxury Jewelry | 1 - 2 |
As you can see, a ratio of 15 would be incredible for a jewelry store but potentially disastrous for a grocer dealing with perishable goods. For a fast-fashion brand, a ratio of 9 is healthy, reflecting the need to clear out seasonal collections before they go out of style. Meanwhile, furniture stores expect a much slower cycle of 3 to 5, since these are expensive, considered purchases.
The number itself isn't the whole story. Whether your ratio is high or low, it’s telling you something important about how your business is running.
A high inventory turnover ratio could mean:
On the other hand, a low inventory turnover ratio might signal:
Ultimately, a "good" inventory turnover ratio is one that fuels healthy cash flow, meets customer demand without constant stockouts, and makes sense for the operational realities of your specific industry.
Of course. Here is the rewritten section, crafted to sound like an experienced human expert and formatted according to your specifications.
An inventory turnover ratio calculator is a powerful tool, but it's only as good as the numbers you feed it. Garbage in, garbage out, as they say. A small mistake in your input can lead to a wildly inaccurate result, pushing you to make flawed business decisions based on a false sense of security or panic.
Let's walk through some of the most common traps I've seen merchants fall into so you can sidestep them and calculate a number you can actually trust.
One of the most frequent—and damaging—errors is using sales revenue instead of the Cost of Goods Sold (COGS). It's an easy mistake to make, but a critical one. Your revenue includes your profit margin, which has nothing to do with the actual cost of the inventory you moved.
Using revenue will always inflate your turnover ratio, making it seem like you're selling through inventory much, much faster than you really are. This creates a dangerous blind spot. You might think your products are flying off the shelves when, in reality, they're starting to gather dust. Always, always use COGS to get a true measure of how efficiently you're moving the actual cost value of your stock.
Another major pitfall is using a single day's inventory value for your calculation. I see this all the time. Someone grabs a number from the last day of the year because it seems efficient, but it rarely tells the whole story.
What if that day was right after a massive holiday restock? Or at the tail end of a clearance sale when your shelves were nearly bare? Either scenario would give you a completely misleading figure. A sudden inventory spike would artificially lower your ratio, making you look inefficient. A post-sale low would inflate it, hiding potential overstocking issues.
Relying on a single point in time to measure inventory is like judging a movie by a single frame. You miss the entire plot. Always use an average inventory figure to smooth out the natural peaks and valleys of your sales cycle.
This is exactly why calculating the average inventory over a period (like a year or a quarter) is non-negotiable for accuracy.
Accuracy demands consistency. When you calculate your ratio, make sure the period for your COGS perfectly matches the period for your average inventory calculation. Comparing a full year of COGS to just one quarter's average inventory is comparing apples to oranges, and your result will be meaningless.
Finally, don't forget about obsolete or dead stock. This is the inventory that's unsellable due to damage, being out of season, or simply falling out of demand. We all have it.
If this dead stock remains on your books, it inflates your average inventory value, which in turn drags down your turnover ratio. This makes your overall inventory performance look worse than it really is and masks the true cost of holding onto these non-performing assets.
Regularly auditing and writing off obsolete stock is good housekeeping. It accomplishes two critical things:
Failing to manage your inventory levels properly can also complicate other critical calculations. For instance, you can learn more about why this is so essential in our guide explaining how to calculate safety stock for your inventory. Ultimately, accurate, clean data is the foundation of any business metric worth tracking.
Knowing your inventory turnover ratio is the first step—like getting a diagnosis. Improving it is where you start building a healthier, more profitable business. When that ratio goes up, it means your cash is working harder for you instead of just collecting dust on a warehouse shelf.
So, let's get past the numbers and into the real strategies that will crank up your efficiency and drive actual growth.
This isn't just about selling more; it's about selling smarter. The goal is to get the right products to the right people at the right time, closing the gap between acquiring stock and turning it into revenue.
Honestly, the most direct path to a better turnover ratio is getting ridiculously good at predicting what your customers want to buy. Over-ordering based on a gut feeling is the number one cause of bloated inventory and a ratio that just won't budge. It's time to let your data do the talking.
Start digging into your historical sales to spot the obvious (and not-so-obvious) patterns. Look for:
Great forecasting isn't just about preventing overstock. It’s also about making sure you don't run out of your bestsellers and disappoint loyal customers. We take a much deeper look at this in our guide to improving demand forecasting accuracy.
Strategic pricing is your secret weapon for moving slow inventory before it becomes a real liability. When you spot a product with a low turnover, don't just sigh and let it sit there. Get proactive with promotions designed to create some buzz.
Here are a few tactics I've seen work wonders:
The whole point is to turn that stagnant inventory back into cash you can reinvest in products people are actually excited to buy.
A well-executed promotion does more than just clear old stock; it creates an opportunity to re-engage customers and drive traffic to your store, potentially leading to sales of your full-priced, high-turnover items as well.
Let's face it: not all of your products are created equal. Some are superstars, and others are just taking up space. A huge part of improving your overall turnover is regularly auditing your product catalog and making some tough calls.
A classic but effective way to do this is with ABC analysis:
Once you’ve tagged your "C" items, you need a game plan. Can a fresh marketing push revive them? Or is it time to liquidate the stock and stop reordering for good? Being ruthless here is the key to freeing up cash and shelf space for products with real potential.
Trying to manually crunch sales data and forecast trends is a massive time sink, especially as your Shopify store scales. This is where modern inventory tools come in, turning mountains of raw data into profitable decisions.
Look at a giant like Walmart. They’ve fine-tuned their supply chain to hit an impressive quarterly inventory turnover rate of 8 to 10 in recent years. That kind of efficiency doesn't happen by accident; it's the result of a deep, data-driven understanding of every item they stock. You can see more on Walmart's turnover efficiency on Statista.com.
While you might not have Walmart's scale, you can absolutely adopt the same data-first mindset with the right tools. Platforms like Tociny.ai are built to automate this entire process for Shopify merchants. It plugs right into your store's data to:
By letting technology handle the heavy lifting, you can spend less time guessing and more time executing strategies that actually improve your inventory turnover and fatten your bottom line.
Once you start plugging in your own numbers, you'll find that the inventory turnover ratio isn't just a simple formula—it's a KPI that brings up a lot of specific "what if" scenarios. It’s one of those metrics that reveals more layers the deeper you dig.
Let's walk through some of the most common questions Shopify merchants ask. My goal here is to help you move from knowing the theory to confidently applying it to your own store.
Honestly, there's no single magic number here. The right frequency really depends on your industry and how quickly your products move.
Here’s my take on it:
For most Shopify stores, I'd suggest starting with a quarterly calculation. It’s frequent enough to be actionable without bogging you down in admin work.
You bet it can. While a high ratio usually signals healthy sales, an extremely high one can be a major red flag. It often means your inventory levels are dangerously lean, setting you up for frequent stockouts.
When you're constantly running out of your bestsellers, you're not just losing sales—you're frustrating your customers. Do it enough, and they'll start looking elsewhere. The goal isn’t just to sell through inventory fast; it's to do it while keeping your products available. A ratio that's off the charts suggests you might be chasing efficiency at the expense of customer satisfaction.
A sky-high turnover ratio might look impressive on a spreadsheet, but if it comes at the cost of lost sales and customer frustration, it's a sign that your reordering strategy needs a second look.
This is a classic point of confusion, but they measure two very different things.
Here’s a simple way to think about it:
Inventory turnover measures speed. It tells you how many times you sold and replaced your entire stock over a period. For example, "We turned our inventory 5 times last year."
Sell-through rate, on the other hand, measures amount as a percentage. It tells you what percentage of a specific batch of inventory you sold. For example, "We sold through 85% of the t-shirts we ordered for the spring collection." It’s much more granular, often used to judge the performance of a single product or campaign.
This is a common scenario for brand-new stores. If you're just starting out, your beginning inventory for that first period is simply $0. Nothing complicated there.
To get your average inventory, you just add that $0 beginning inventory to your ending inventory value and divide by two.
For instance, if you started with nothing and ended the quarter with $10,000 in stock, your average inventory would be ($0 + $10,000) / 2 = $5,000. You can then pop that $5,000 figure into your inventory turnover ratio calculator and you're good to go.
Ready to stop guessing and start making data-driven inventory decisions? Tociny.ai is an AI-powered analytics platform that automates your inventory calculations, forecasts demand, and provides clear, actionable recommendations to boost your profitability. Join our private beta for early access and one-on-one guidance. Learn more and sign up at https://tociny.ai.
Tociny is in private beta — we’re onboarding a few select stores right now.
Book a short call to get early access and exclusive insights.