Running a successful Shopify store means mastering the art of prediction. Guessing wrong on inventory leads to two costly problems: overstocking ties up cash in slow-moving products, while understocking results in lost sales and disappointed customers. The key to navigating this challenge isn't a crystal ball; it's a robust forecasting strategy built on reliable data and proven techniques.
Traditional methods often fall short in the dynamic world of D2C e-commerce, where trends shift overnight and marketing campaigns can cause demand to spike unexpectedly. This guide moves beyond basic guesswork to provide a comprehensive roundup of 10 essential methods to forecast sales, from foundational statistical models to advanced AI-powered techniques. We cut directly to the actionable strategies you need to build a more accurate, resilient, and profitable inventory plan.
Inside, you will find a practical toolkit designed specifically for e-commerce merchants. We will explore the pros, cons, and best-use cases for each forecasting approach, empowering you to select the right methods for your unique business needs. You'll learn how to implement everything from Time Series Analysis and Machine Learning models to Qualitative techniques and Bottom-Up forecasting. Whether you're a seasoned merchant with years of data or a growing brand launching new products, this listicle offers the specific insights needed to turn historical data into a powerful competitive advantage. Get ready to replace uncertainty with a clear, data-driven vision for your inventory and sales.
Time Series Analysis (TSA) is one of the foundational methods to forecast sales, using your brand's historical data to predict future performance. This technique treats past sales as a sequence of data points indexed over time (e.g., daily, weekly, monthly). The core idea is to decompose this data into three components: trend (long-term upward or downward movement), seasonality (predictable, cyclical patterns like holiday rushes), and residuals (random, unpredictable noise). By isolating these patterns, you can project them forward to create a reliable forecast.
Smoothing techniques, like Moving Averages and Exponential Smoothing, are popular TSA approaches. A Simple Moving Average (SMA) calculates the average of sales over a specific recent period (e.g., the last 14 days) to smooth out short-term fluctuations and clarify the underlying trend. Exponential Smoothing gives more weight to recent data, making it more responsive to recent shifts in sales velocity. For example, a home goods retailer might use a 14-day moving average to smooth weekend sales spikes, while a fast-fashion brand would use exponential smoothing to quickly react to a newly trending item.
This approach is ideal for businesses with at least two years of consistent sales history, allowing the model to accurately capture annual seasonality. It excels at short to medium-term forecasting (e.g., 1-6 months out) for established products with predictable demand cycles, like a wellness brand forecasting a January spike in supplement sales.
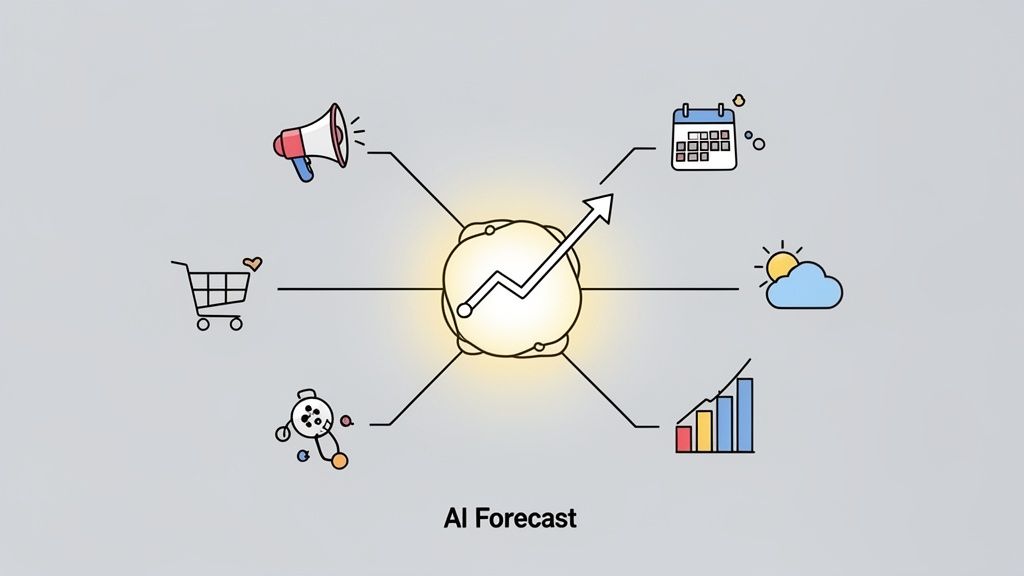
Machine Learning (ML) and Artificial Intelligence (AI) represent a leap forward from traditional methods to forecast sales. Instead of relying solely on historical sales data, these advanced models ingest and learn from a multitude of data sources simultaneously. This includes your past sales, promotional calendars, website traffic, inventory levels, and even external signals like competitor pricing or weather patterns. Using algorithms like gradient boosting, neural networks, and ensemble models, an AI-powered system identifies complex, non-linear relationships that simpler models would miss, allowing it to adapt continuously as new data arrives.
The primary advantage of ML is its ability to model complexity and improve over time. For example, Amazon’s forecasting system analyzes billions of data points to optimize its massive inventory network, while D2C health brands use ML to predict seasonal supplement demand with incredible precision. Purpose-built platforms for Shopify, like Tociny.ai, make this technology accessible by automating the entire process from data integration to generating SKU-level forecasts, helping merchants prevent stockouts and reduce overstock. You can learn more about how AI transforms demand planning for modern D2C brands.
This approach is best for businesses that need highly accurate, granular forecasts and have multiple influencing factors beyond just time. It’s perfect for brands running frequent promotions, dealing with fast-changing trends (like fashion or electronics), or managing a large catalog of products where manual forecasting is impossible. If your business is scaling rapidly and needs to optimize inventory investments dynamically, AI is the superior choice.
Qualitative forecasting is one of the essential methods to forecast sales when historical data is limited or unreliable. Instead of relying solely on past numbers, this technique leverages human expertise, intuition, and on-the-ground insights from sales teams, merchandisers, and industry experts. The core idea is to synthesize subjective judgments to predict future performance, making it invaluable for launching new products, entering new markets, or navigating periods of significant change where past data is no longer a reliable indicator of the future.
This method often involves structured techniques like the Delphi method, where a panel of experts provides anonymous forecasts that are then aggregated and shared for further refinement, reducing groupthink bias. For example, a fashion D2C brand's merchandising team would use expert judgment to forecast demand for a completely new collection, while a health and wellness brand's sales team could predict an uptick in vitamin D sales ahead of winter based on conversations with retail partners and market sentiment.
This approach is best suited for situations with high uncertainty or a lack of historical data. It's ideal for forecasting demand for new product launches, assessing the impact of a major marketing campaign, or predicting sales during unprecedented market shifts. A consumer electronics company, for instance, would lean on expert opinion to forecast demand for a viral new gadget before historical sales patterns have emerged.
Regression Analysis is a powerful statistical method to forecast sales by identifying and quantifying the relationship between a dependent variable (sales) and one or more independent variables (sales drivers). Unlike time-series models that rely solely on past sales data, regression explains why sales fluctuate. It helps you understand how factors like marketing spend, pricing, website traffic, or even competitor promotions impact your revenue. The output is a formula that models these relationships, allowing you to run what-if scenarios and predict outcomes.
For example, a fashion retailer could use regression to determine that for every 10% increase in discount, sales volume for a specific category rises by 15%. Similarly, a consumer electronics brand might find that a $1,000 increase in daily paid ad spend correlates with an additional $5,000 in sales. This model transforms forecasting from a simple projection into a strategic planning tool, revealing the precise ROI of different business levers.
Regression analysis is ideal for businesses that want to move beyond historical forecasting and understand the underlying drivers of sales performance. It's particularly effective for medium to long-term planning (3-12 months) and for evaluating the potential impact of strategic decisions, such as testing price elasticity, allocating a new marketing budget, or planning a major promotional calendar. It requires clean, granular data for both sales and the independent variables you wish to test.
Seasonal Decomposition is one of the more intuitive methods to forecast sales, focusing on isolating and quantifying predictable, recurring patterns in your data. This technique breaks down historical sales into a base level (or trend) and a seasonal index, which is a factor that represents how much sales typically deviate from the average during a specific period. For instance, a seasonal index of 1.2 for December means sales are expected to be 20% higher than average, while an index of 0.8 for August means they are 20% lower. By applying these indexes to a base sales forecast, you can accurately predict seasonal peaks and troughs.
This method works by calculating the average sales for a full cycle (e.g., a year) and then determining the ratio of each period's sales (e.g., each month) to that average. For example, a home goods company might analyze past years' data to find that outdoor furniture sales in spring are consistently three times higher than the annual monthly average, giving them a seasonal index of 3.0 for those months. Similarly, a wellness retailer could apply an index of 1.8 to January to precisely forecast the surge in demand for fitness products driven by New Year's resolutions.
This approach is highly effective for businesses with strong, predictable seasonality and at least two to three years of clean historical data. It is perfect for forecasting demand in categories like fashion, where a D2C brand can predict a 40% jump in winter coat sales in Q4, or for food and beverage brands forecasting demand for holiday gift boxes around Thanksgiving and Christmas.
Lead Time Demand Forecasting is a critical operational method that directly connects sales forecasts to inventory management. Instead of predicting sales over a general future period, this technique specifically calculates the total demand expected during the supplier lead time, which is the window between placing a purchase order and receiving the goods. It answers the crucial question: “How much will we sell before our next shipment arrives?” This makes it foundational for setting reorder points and calculating necessary safety stock to prevent stockouts.
The core calculation involves multiplying the average daily sales by the lead time in days. For instance, a health and wellness brand with a 30-day supplier lead time and average sales of 100 units per day would have a lead time demand of 3,000 units. This figure then informs a reorder point, often with added safety stock to buffer against unexpected demand spikes or supplier delays. It is one of the most practical methods to forecast sales for inventory replenishment.
This method is essential for any business managing physical inventory, especially D2C brands that need to maintain high service levels without overinvesting in stock. It is particularly effective for businesses with long or variable supplier lead times, as it highlights the inventory risk associated with that delay. It’s a non-negotiable technique for scaling inventory operations and moving from reactive to proactive replenishment.
Bottom-up forecasting, also known as build-up forecasting, is a granular approach that starts at the most detailed level of your business and aggregates forecasts upward. Instead of starting with a high-level business goal, this method begins with predictions for individual units, typically Stock Keeping Units (SKUs). Merchandisers or category managers forecast sales for each product, which are then rolled up to create forecasts for subcategories, categories, and finally, the entire business. This makes it one of the most accurate methods to forecast sales for inventory management.
This approach gives you a highly detailed view of demand, which is crucial for precise inventory planning. For example, a fashion D2C brand would have merchandisers forecast demand for each specific size and color combination of a core t-shirt. These individual SKU forecasts are then combined to predict total sales for that t-shirt style, then for the entire "Tops" category, and so on. This prevents overstocking unpopular sizes while ensuring best-sellers are always available, directly aligning with Shopify's product-centric inventory structure.
This method is ideal for businesses with a diverse product catalog where different items have unique demand patterns. It is especially powerful for brands that rely on precise SKU-level inventory control to manage cash flow and avoid stockouts, such as those in fashion, consumer electronics, or health and wellness. It’s the go-to strategy when you need to make specific purchasing and replenishment decisions at the product level.
Causal forecasting moves beyond historical sales data to identify the "why" behind your sales performance. This method builds a model that connects sales outcomes to specific internal and external drivers, such as marketing spend, promotional activities, price changes, or even competitor actions. By quantifying the relationship between these variables and sales, you can create forecasts that react to your strategic decisions. This makes it one of the most powerful methods to forecast sales for proactive planning and scenario analysis.
Instead of just looking at past trends, a causal model can answer questions like, "What will be the sales lift if we run a 20% discount?" or "How will a $5,000 increase in paid ad spend impact next month's revenue?". For example, a home goods company could use this method to quantify the exact sales increase from a holiday promotion versus baseline demand. Similarly, a fashion retailer could model the impact of an influencer collaboration on a specific product, accounting for a 3 to 7-day lag between the post and the sales spike.
This approach is best for D2C brands that rely heavily on strategic drivers like marketing campaigns, promotions, and pricing to influence demand. It’s perfect for medium to long-term planning, budget allocation, and measuring marketing ROI. If you want to understand how specific actions will affect future sales, rather than just extrapolating from the past, causal forecasting is the ideal choice.
Scenario and Sensitivity Analysis is a strategic method to forecast sales that acknowledges uncertainty by creating multiple plausible futures. Instead of producing a single-point forecast, this technique builds several distinct scenarios, typically categorized as optimistic, realistic (or baseline), and pessimistic. Each scenario is based on a different set of assumptions about key internal and external variables, such as marketing campaign performance, competitor actions, or economic conditions. This allows you to quantify potential risks and opportunities and develop proactive contingency plans.
Sensitivity analysis is a complementary technique used to pinpoint which variables have the most significant impact on your sales forecast. By systematically adjusting one assumption at a time (e.g., conversion rate or average order value) and observing the effect on the outcome, you can identify your most critical business drivers. For instance, a home goods company might use sensitivity analysis to determine if a 15-day supplier lead time delay has a greater impact on sales than a 10% drop in ad spend, helping them prioritize risk mitigation efforts.
This forward-looking approach is essential for strategic planning, especially when launching a new product, entering a new market, or navigating a volatile environment. It is invaluable for businesses that face significant uncertainties that historical data alone cannot predict. For example, a fashion brand planning a major seasonal collection would use this method to model scenarios based on varying levels of demand, from a conservative 10% sell-through to an optimistic 25% sell-through, ensuring they don’t overbuy or understock inventory.
Inventory-Based Demand Sensing is a highly responsive method to forecast sales by using real-time inventory and point-of-sale (POS) data to detect immediate shifts in consumer demand. Instead of relying solely on historical sales, this technique monitors daily and even hourly inventory movements, stock-outs, and backorders to identify emerging trends. The core principle is that the speed at which inventory depletes is a powerful, immediate signal of true customer demand, allowing for rapid adjustments to forecasts and operations.
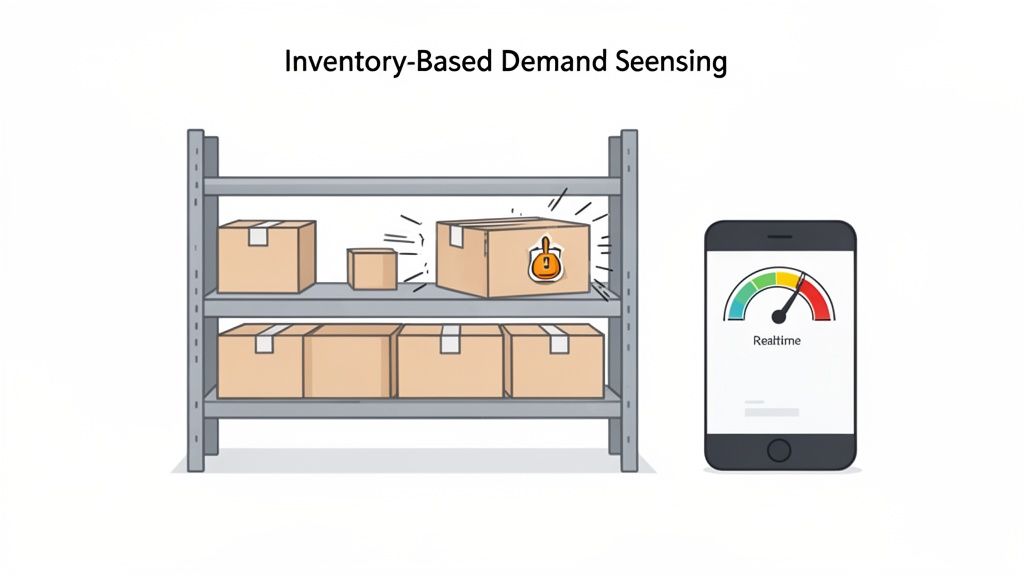
This method acts as an early warning system. For instance, a fashion retailer might notice a previously slow-moving style suddenly trending on TikTok, a change visible within 48 hours in its inventory data as the item’s depletion rate spikes. Similarly, a food and beverage brand can identify that a limited-edition flavor is selling out two weeks ahead of schedule, enabling a quick decision to either restock or adjust marketing. This real-time visibility allows brands to capitalize on unexpected opportunities and mitigate stock-out risks before they impact revenue.
Demand sensing is perfect for businesses with fast-moving inventory, high-demand volatility, or products susceptible to viral trends, like fashion, supplements, or consumer electronics. It's particularly effective for short-term operational adjustments (e.g., daily or weekly) rather than long-range strategic planning. It complements traditional forecasting by providing a real-time layer of intelligence.
| Method | Implementation complexity | Resource requirements | Expected outcomes | Ideal use cases | Key advantages |
|---|---|---|---|---|---|
| Time Series Analysis (TSA) & Smoothing Methods | Low — simple models and tuning | Minimal compute; historical sales (5–24+ months) | Reliable short–to–medium term forecasts; trend/seasonality detection | Stable SKUs with established seasonality; tactical 1–4 week planning | Easy to explain, low cost, fast to update |
| Machine Learning and AI-Powered Forecasting | High — model training, validation, maintenance | Large datasets, significant compute, ML expertise | High accuracy for complex patterns; adaptive predictions | Large catalogs, multi-source data, complex demand drivers | Detects non-linear effects; integrates many signals |
| Qualitative Forecasting (Sales Pipeline & Expert Judgment) | Low–Medium — process and coordination heavy | Expert time, structured inputs; little historical data needed | Insightful, context-rich forecasts for data-scarce cases | New products, market entry, disruptive periods | Captures tacit knowledge; aligns strategy with forecasts |
| Regression Analysis | Medium — statistical modeling and feature selection | Historical sales plus driver data; analyst skill | Interpretable coefficients; what‑if and ROI insights | Pricing tests, marketing impact measurement, ROI analysis | Transparent, quantifies driver effects, hypothesis testing |
| Seasonal Decomposition and Index Methods | Low–Medium — decomposition and indexing | 2+ years historical data; basic tooling | Accurate recurring-season forecasts; clear seasonal indices | Retail with strong weekly/monthly/annual seasonality | Intuitive, explainable seasonal adjustments |
| Lead Time Demand Forecasting | Low — formula-driven calculations | Accurate lead time data; demand variance metrics | Precise reorder points and safety stock recommendations | Replenishment planning, supplier-managed inventory | Actionable outputs for ordering; reduces stockouts |
| Bottom-Up / Build-Up Forecasting | Medium–High — granular forecasting and rollup | SKU-level data, merchandiser input, aggregation systems | Highly actionable SKU-level plans aligned to operations | SKU-centric businesses, merchandising and assortment planning | Granular accuracy; direct operational alignment |
| Causal Forecasting & External Variable Analysis | High — data integration and causal modeling | Clean external driver data; advanced analytics | Quantified impact of drivers; scenario and ROI analysis | Campaign-driven brands, promotion and pricing strategy | Measures driver effects; enables scenario planning |
| Scenario and Sensitivity Analysis | Medium — multiple scenarios and sensitivity testing | Forecast baselines, stakeholder inputs, modeling tools | Range of plausible outcomes; risk quantification | High-uncertainty launches, supply risk, strategic planning | Highlights risks, supports contingency planning |
| Inventory-Based Demand Sensing | Medium–High — real-time integration and rules | Real-time POS/inventory feeds; monitoring platform | Early detection of demand shifts; rapid response signals | Fast-moving SKUs, trend-driven products, promotions | Fast detection of trends; reduces stockouts, enables dynamic action |
Navigating the complex world of e-commerce demand requires more than just a single crystal ball. As we've explored, the journey to accurate sales forecasting isn't about finding one perfect method but about building a versatile, hybrid engine tailored to your brand's unique challenges and opportunities. You wouldn't use the same tool to build an entire house, and similarly, relying on a single one of the many methods to forecast sales is a recipe for error.
The true power lies in strategic combination. Your stable, evergreen products might thrive on the historical reliability of Time Series Analysis, while your fast-moving, trend-sensitive categories demand the pattern-recognition prowess of Machine Learning. For a high-stakes new product launch, blending the quantitative output of a causal model with the qualitative insights from your marketing team and industry experts creates a much more robust and defensible projection. This integrated approach transforms forecasting from a static, isolated calculation into a dynamic, strategic process.
The ultimate goal is to create a forecasting system that is as agile and resilient as your business aims to be. The most effective D2C brands don't just "do forecasting"; they cultivate a forecasting culture. This means moving beyond a simple number and understanding the story that number tells.
Key takeaways to build your hybrid model include:
Mastering these methods to forecast sales is about more than just managing inventory; it’s about unlocking capital, improving cash flow, and enhancing customer satisfaction. An accurate forecast is the foundational input for nearly every critical decision you make, from negotiating with suppliers and planning warehouse staffing to allocating your marketing budget and setting strategic growth targets.
When you can confidently predict future demand, you stop reacting to the market and start shaping your outcomes within it. You reduce the capital tied up in slow-moving safety stock, minimize the lost revenue from stockouts, and build a reputation for reliability that turns one-time buyers into loyal customers. The shift is profound: you move from being a passenger, subject to the whims of market volatility, to being the pilot, using data to navigate toward profitability and sustainable growth. The initial effort to move beyond basic spreadsheets and implement a structured, multi-faceted forecasting process pays dividends across your entire operation, creating a powerful competitive advantage.
Ready to automate the complexity and build a world-class forecasting engine without the manual effort? Tociny.ai uses advanced AI to analyze your sales data, automatically select the best forecasting models for each SKU, and deliver actionable inventory recommendations. Stop guessing and start growing by visiting Tociny.ai to see how you can transform your data into your most valuable asset.
Tociny is in private beta — we’re onboarding a few select stores right now.
Book a short call to get early access and exclusive insights.