
A simple way to get started with safety stock is the Average-Max formula: (Maximum Daily Sales × Maximum Lead Time) – (Average Daily Sales × Average Lead Time). This method acts as a basic shield, protecting you against the worst-case scenarios you've seen in the past—both for sales spikes and supplier delays. It gives you a straightforward buffer to keep stockouts at bay.
Staring at your inventory report, it's tempting to just go with your gut. Maybe you add a few "just-in-case" units or apply a simple rule of thumb for your safety stock. But this intuition-based approach is a gamble, one that usually ends in one of two expensive ways: cash-draining overstocks or reputation-damaging stockouts.
For a D2C brand, especially heading into a peak sales season, getting this number right is the difference between record profits and missed opportunities.
This guide is about moving beyond those unreliable estimates. We'll break down how to calculate safety stock not as a chore, but as a strategic lever to unlock cash flow and keep your customers happy. The minute you shift from guesswork to data-driven calculations, the benefits start rolling in.
Before we get into the nitty-gritty of the formulas, let's get comfortable with the key ingredients. These variables are the building blocks for any solid safety stock calculation, whether you're working in a simple spreadsheet or using a more sophisticated inventory system.
To give you a quick reference before we dive deeper, here's a look at the core concepts you'll be working with.
| Concept | What It Is | Why It Matters for Your Store |
|---|---|---|
| Lead Time | The total time from when you place a purchase order with your supplier to when the inventory actually arrives in your warehouse. | Unpredictable lead times are one of the biggest culprits behind stockouts. If you can't measure this accurately, you'll never be able to time your reorders perfectly. |
| Demand Variability | The natural fluctuation in your daily or weekly sales for a specific product. Some products sell like clockwork; others are all over the place. | High variability means your sales are hard to predict. That requires a larger safety buffer to protect you from running out of stock during those sudden, unexpected spikes. |
| Service Level | The target probability of not stocking out, which you express as a percentage (like 95%). It’s how often you want to have an item on hand when a customer wants it. | This is where strategy comes in. It helps you balance the cost of holding inventory against the risk of a lost sale, letting you give more protection to your most important products. |
Getting a handle on these data points is the first real step.
By moving away from arbitrary "weeks of supply" rules and embracing these metrics, you transform inventory management from a reactive headache into a proactive strategy. It’s how you start building a more resilient and profitable e-commerce operation.
Picking the right way to calculate safety stock isn't about finding the most complicated formula. It's about matching the method to your business's reality—how mature your data is, how predictable your products are, and how much uncertainty you face from both customers and suppliers.
Let's unpack four distinct methods, moving from the simplest approach to more statistically powerful calculations. Each has its place, and knowing them will help you pick the perfect tool for your Shopify store.
The chart below shows the high-level decision every inventory manager faces. You can either rely on guesswork or shift to a more structured, data-driven approach.
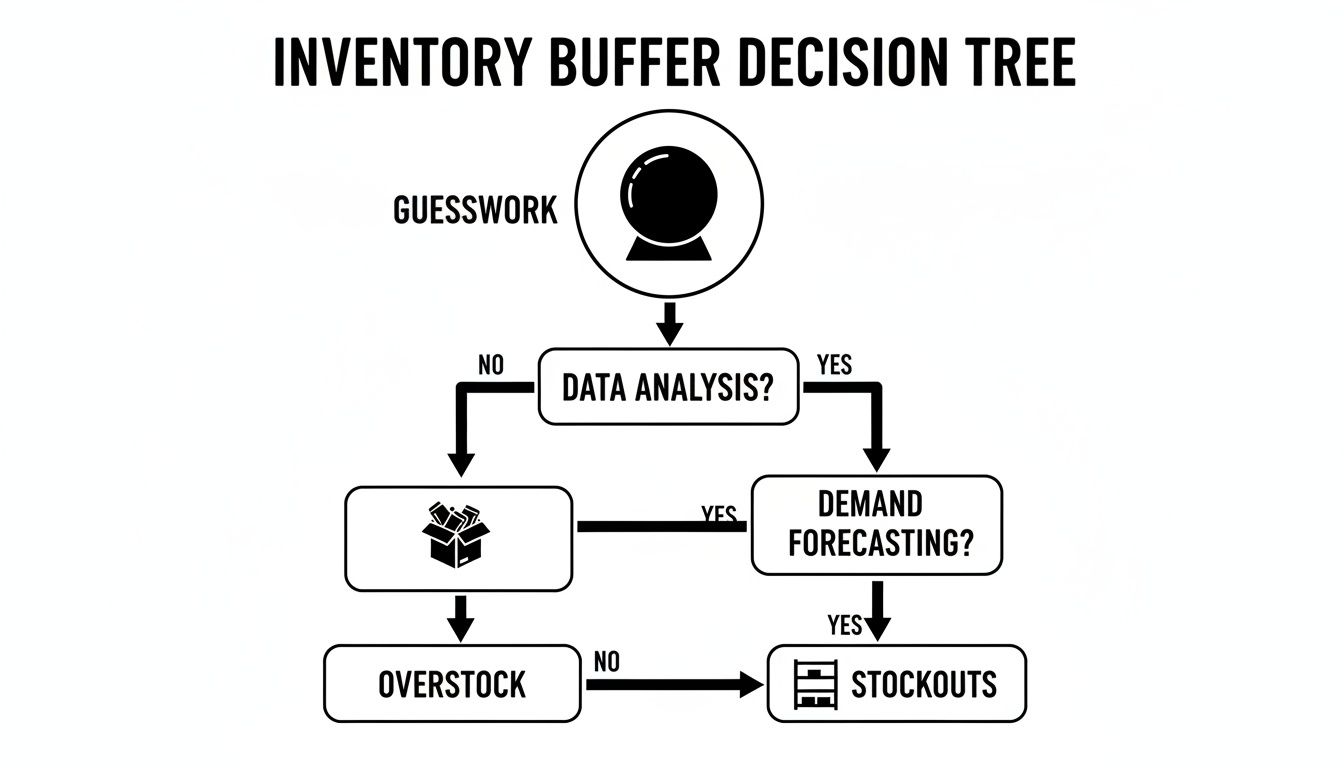
As you can see, intuition often leads to the costly extremes of overstock or stockouts. A data-informed strategy is your path to finding that profitable balance.
The most basic way to start is by setting a fixed quantity of safety stock for a product. This is a static number you and your team agree on based on experience and a general feel for the product.
For example, you might decide to always keep an extra 50 units of your best-selling t-shirt on hand. This isn't based on a fancy calculation, but rather a gut feeling that 50 units provide a reasonable cushion.
This approach only really works for products with incredibly stable demand and rock-solid suppliers. The big drawback is its rigidity; a fixed number can't adapt to seasonality, market trends, or a sudden change in supplier performance, making it a risky bet for most e-commerce products.
A solid step up from a fixed number is the "Average-Max" method. This formula taps into your own historical data to build a buffer against the worst-case scenarios you've already lived through.
Imagine you're running a Shopify store in the fast-moving fashion niche, where a trend can cause demand to spike overnight. The Average-Max formula is a straightforward, "better safe than sorry" approach that guards against past extremes in both lead times and sales.
The formula is: Safety Stock (SS) = (Max Lead Time × Max Sale) – (Average Lead Time × Average Sale).
Let's say your data shows an average lead time of 5 days and average daily sales of 100 units. But during a supplier delay, your max lead time hit 10 days, and during a Black Friday sale, sales peaked at 200 units in one day.
Plugging that in: SS = (10 × 200) – (5 × 100) = 2000 – 500 = 1500 units.
This method is popular because it’s intuitive and uses data you likely already have in your Shopify analytics. It creates a more tailored buffer than a fixed number by acknowledging your store's unique history.
When your main headache is unpredictable customer demand, but your suppliers are fairly consistent, you can use a formula that isolates that demand variability. This is where we bring in a key statistical concept: standard deviation.
Standard deviation (σ) simply measures how much your sales typically bounce around the average. A high standard deviation means sales are all over the place; a low one means they're steady.
The formula is: Safety Stock = Z-Score × Standard Deviation of Demand (σD) × √Average Lead Time
Let's quickly break that down: * Z-Score: This number reflects your desired service level. For a 95% service level (you want to be in stock 95% of the time), the Z-Score is 1.65. * Standard Deviation of Demand (σD): This is the standard deviation of your sales over a period, like daily or weekly. * Average Lead Time: The average time it takes for your supplier to get you your order.
Here's a quick example: An electronics store sells a popular gaming mouse. Their supplier is reliable, with an average lead time of 7 days, but demand is volatile. Looking at their Shopify sales data, they find the standard deviation of daily demand is 15 units. To hit a 95% service level (Z-Score of 1.65), their calculation is: Safety Stock = 1.65 × 15 × √7 ≈ 65 units.
This statistical approach gives you a much more nuanced buffer, automatically increasing safety stock for volatile products and reducing it for stable ones.
This is the most robust and accurate method for most Shopify stores. Why? Because it acknowledges a critical reality: both customer demand and supplier lead times can be unpredictable. Things go wrong on both ends, and this formula protects you from that dual uncertainty.
The full statistical formula looks like this: Safety Stock = Z-Score × √((Average Lead Time × σD²) + (Average Demand² × σLT²))
Here's what the new variables mean: * σD²: The variance of demand (which is just the standard deviation of demand squared). * Average Demand: Your average daily sales. * σLT²: The variance of lead time (standard deviation of lead time squared). For more on this, check out our guide on calculating lead time.
This formula calculates the risk from demand swings and the risk from lead time delays separately, then combines them to give you a complete picture of your exposure.
Let's see it in action for a home goods brand: A store sells a popular ceramic vase and wants a high 98% service level (Z-Score of 2.05). * Average Lead Time = 10 days * Standard Deviation of Lead Time (σLT) = 3 days * Average Daily Demand = 20 units * Standard Deviation of Demand (σD) = 5 units
Plugging this into the formula: SS = 2.05 × √((10 × 5²) + (20² × 3²)) SS = 2.05 × √(250 + 3600) SS = 2.05 × √3850 SS = 2.05 × 62 Safety Stock ≈ 127 units
By using this advanced calculation, the brand can hold a scientifically determined buffer that precisely covers its unique mix of market and supply chain risks, ensuring it can meet customer demand with confidence.
Choosing the right method can feel overwhelming, so I've put together this table to help you match an approach to your store's specific situation. Think about the data you have available and how much variability you're dealing with.
| Method | Best For | Data Required | Pros | Cons |
|---|---|---|---|---|
| Fixed Quantity | New stores, products with extremely stable demand and lead times. | Basic product knowledge, gut feeling. | Very simple to implement. No calculations needed. | Inflexible; doesn't adapt to any changes in demand or supply. |
| Average-Max | Stores with historical sales data but limited statistical expertise. | Historical sales and lead time data (average and maximums). | Easy to understand and calculate. Uses your actual past performance. | Assumes past worst-case scenarios will repeat, can lead to overstocking. |
| Std. Dev. of Demand | Businesses with reliable suppliers but unpredictable customer demand. | Service level, avg. lead time, standard deviation of demand. | More accurate for demand volatility. Tailors buffer to product-specific risk. | Ignores supplier variability, which can be a major source of stockouts. |
| Full Statistical | Most established stores facing both demand and lead time uncertainty. | Service level, avg. demand & lead time, std. dev. of both. | The most accurate and comprehensive method. Balances risk from all sides. | Requires more data and can be complex to calculate manually. |
Ultimately, the best method is the one you can implement consistently and accurately. If you're just starting out, the Average-Max formula is a huge improvement over guesswork. As your business grows and your data becomes richer, moving to a full statistical model will give you the most precise control over your inventory investment.
Once you start using statistical methods for safety stock, you'll see a new variable pop up in the formulas: the Z-score. This isn't just some random number; it's the direct mathematical translation of your desired service level.
Think of your service level as the promise you make to your customers. A 95% service level means you're aiming to have an item in stock and ready to ship 95% of the time someone tries to buy it. This shifts your safety stock calculation from being a simple reaction to what happened last month into a strategic decision about customer satisfaction versus inventory risk. The higher your service level, the higher your Z-score, and the more safety stock you'll need to carry.
Picking the right percentage is a crucial balancing act. A 99% service level sounds incredible from a customer's perspective, but it requires a much, much larger investment in inventory than, say, an 85% or 90% level. Is it really worth tying up that much cash in every single product? For almost every brand, the answer is a hard no.
The Z-score itself is pulled from a standard normal distribution table, which simply maps your target service level percentage to a specific statistical value. You don't need to be a statistician to get this right—you just need to know the common values that successful e-commerce brands rely on.
Here’s a quick reference table to make it easy:
| Desired Service Level | Z-Score to Use | What It Means for Your Inventory |
|---|---|---|
| 85% | 1.04 | A common choice for slower-moving "C" items. |
| 90% | 1.28 | A solid, balanced option for mid-tier "B" items. |
| 95% | 1.65 | The most widely used level for important, steady sellers. |
| 98% | 2.05 | Reserved for your best-selling, high-margin "A" items. |
| 99% | 2.33 | Used for critical products where a stockout is unacceptable. |
Notice how the Z-score jumps significantly as you get closer to 100%. That reflects the reality of inventory: covering those last few percentage points of certainty requires an exponentially larger buffer.
Applying a single, blanket service level across your entire product catalog is one of the most common—and costly—mistakes brands make. Your top-selling hero product and a slow-moving, low-margin accessory simply shouldn't get the same inventory protection. This is exactly where ABC analysis comes into play.
The technique is straightforward: segment your products based on how much value they bring to your business.
By applying tiered service levels, you can strategically put your inventory dollars to work where they'll have the biggest impact on your bottom line.
Example in Action: A Health and Wellness Brand
Picture a Shopify store that sells supplements. Their star "A" item is a best-selling protein powder that drives most of their profit. Their "B" items are various vitamins, and their "C" items are niche accessories like branded water bottles.
They decide on a tiered service level strategy:
- Protein Powder (A Item): They set a 98% service level (Z-score = 2.05). They absolutely cannot afford for this to go out of stock, as it would hammer their sales and erode customer trust.
- Vitamins (B Items): These get a 90% service level (Z-score = 1.28). A stockout isn't great, but it's far less catastrophic than running out of the protein powder.
- Water Bottles (C Items): These are assigned an 85% service level (Z-score = 1.04). This provides a minimal buffer without tying up a bunch of cash in slow-moving merch.
This segmented approach lets the brand optimize its safety stock. They are heavily protected on their most important products while keeping their overall inventory investment lean and efficient.
Theory and formulas are great, but let's be honest—the real test is seeing how this all works with an actual product in a real-world store. We're going to walk through a complete, hands-on example for a fictional Shopify home goods brand I'll call "The Urban Kiln." This will show you exactly how to compute safety stock when you're dealing with the classic e-commerce headache: unpredictable demand and unpredictable lead times.
The Urban Kiln's star product is a handcrafted ceramic planter. Sales are solid, but they swing with home decor trends, and their artisan supplier has delivery times that are... let's just say, inconsistent. This is the perfect storm, making it a prime candidate for the full statistical safety stock formula. It's designed to handle exactly this kind of two-front uncertainty.
First things first, we need to round up five key data points for our formula. You don’t need a fancy system for this; the info is already sitting in your Shopify reports and supplier emails.
1. Desired Service Level (and Z-Score): The planter is a signature "A" item—a major revenue driver. To keep customers happy and sales flowing, The Urban Kiln is aiming for a 95% service level. Looking at our Z-score table, a 95% service level corresponds to a Z-score of 1.65.
2. Average Daily Demand (D_avg): Jump into your Shopify Analytics and head to Reports > Sales > Sales by product. Filter for the ceramic planter over the last 90 days to see the total quantity sold.
* Example: They sold 1,350 units in the last 90 days.
* Calculation: 1350 units / 90 days = 15 units/day. Easy enough.
3. Standard Deviation of Demand (σ_demand): This number tells you how much your daily sales typically bounce around that 15-unit average. To get it, you'll need to export your daily sales data for the planter into a spreadsheet.
* Action: In Excel or Google Sheets, pop your daily sales for the past 90 days into a single column. Then, use the STDEV.S() function on that data.
* Example: The spreadsheet spits out a value of 5 units. This means sales often swing by 5 units above or below the daily average.
4. Average Lead Time (LT_avg): Pull up your last 5-10 purchase orders for this planter. You’re looking for the time elapsed between placing the order and the goods actually arriving at your warehouse. * Example: The last five lead times were 12, 10, 14, 9, and 10 days. * Calculation: (12 + 10 + 14 + 9 + 10) / 5 = 11 days.
5. Standard Deviation of Lead Time (σ_LT): Now, use that same set of lead times from the previous step. Back in your spreadsheet, run the STDEV.S() function on those numbers.
* Example: For the lead times (12, 10, 14, 9, 10), the standard deviation comes out to 2.1 days.
For anyone running a store in a dynamic niche like home goods, this statistical method is a game-changer. It’s far more precise than a simple rule of thumb because it accounts for both customer behavior and supplier reliability.
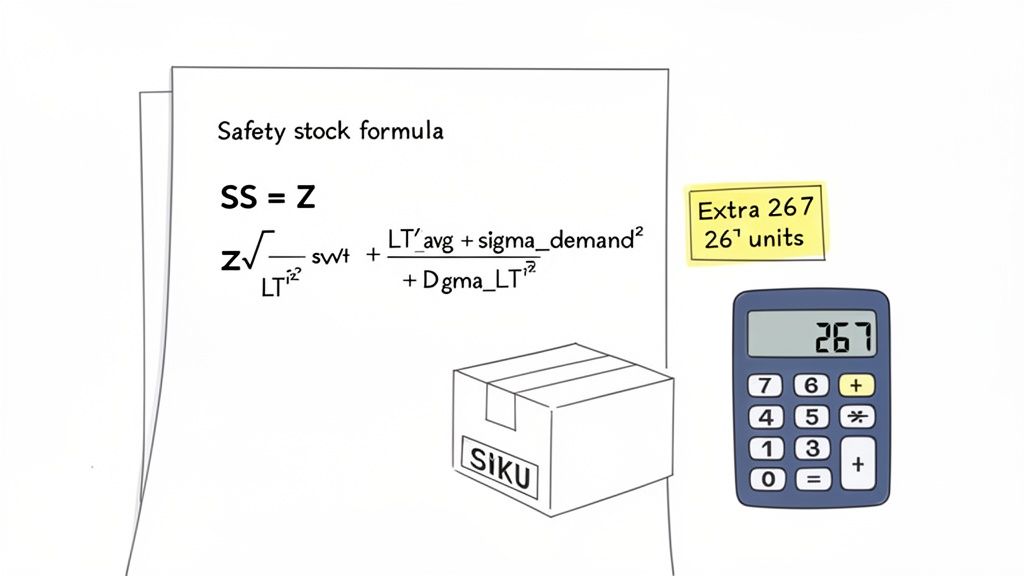
Okay, we have all our ingredients. It's time to plug them into the formula that handles both demand and lead time variability:
Formula: SS = Z × √((LT_avg × σ_demand²) + (D_avg² × σ_LT²))
Let's substitute the values we just gathered:
Now, let's break down the calculation piece by piece:
The Urban Kiln needs to hold an extra 59 units (we'll round up) of this planter as safety stock. This buffer ensures they can maintain that 95% service level, weathering both unexpected sales spikes and supplier delays without letting their customers down.
That final number isn't just a guess; it's a data-driven buffer custom-built for the specific risk profile of this product. By following this process, you can get beyond guesswork and start building a much more resilient and profitable inventory strategy. If you're managing this all manually, our guide on creating an effective inventory spreadsheet can be a fantastic starting point for keeping your data organized.
The manual formulas we’ve covered are powerful, but they share a common weakness: they depend entirely on static, historical data and a ton of time-consuming spreadsheet work. This might work when you have a handful of products, but what happens when your Shopify store scales to hundreds or even thousands of SKUs?
The process quickly falls apart.
Spreadsheets just can't keep up. The data is stale the moment you export it, human error is almost guaranteed, and you end up spending more time wrestling with VLOOKUPs than making strategic decisions. You’re essentially managing your inventory by looking in the rearview mirror—a risky way to navigate a fast-changing market.
This is where a modern, automated approach completely changes the game. Instead of you manually pulling data and plugging it into formulas, AI-powered platforms like Tociny.ai connect directly to your Shopify store's live data stream. This creates a breathing, dynamic system for inventory optimization.
The real difference is the move from reactive to predictive analysis. An AI forecasting engine doesn't just look at past sales averages; it identifies the underlying patterns that a spreadsheet would completely miss.
This dashboard view from Tociny.ai shows exactly how sales forecasts are visualized, moving beyond a simple number to show you the actual trend.

This lets you see not just where you've been, but where the data suggests you're going—which is everything for proactive inventory planning.
An integrated platform automates the entire calculation process we walked through earlier. It continuously monitors demand variability and lead time fluctuations in real-time, recalculating the perfect safety stock level for every single SKU.
Instead of a quarterly spreadsheet update, you get a system that provides dynamic safety stock recommendations that adapt daily to what’s actually happening in your business. This frees you from hours of manual work and minimizes the costly errors that come from using outdated information.
For businesses that are serious about moving beyond manual methods, exploring advanced AI solutions with tools like AI Data Chat features can completely transform inventory analysis. The goal is to make more profitable inventory decisions without getting buried in data.
The system handles all the complex math so you can focus on strategy—like setting the right service levels for your most important products. This approach not only saves an incredible amount of time but also directly boosts your bottom line by cutting down on both overstock and stockouts.
Ultimately, this all leads to the system automatically creating replenishment orders. You can learn more about how that works in our guide to automated purchase orders.
Once you've got the formulas down, a whole new set of practical questions pop up. It's one thing to calculate a number in a spreadsheet; it's another to confidently apply it across your entire product catalog.
Let's walk through some of the most common questions we hear from store owners when they start working with real data. Answering these is key to bridging the gap between theory and what you actually do day-to-day.
Treating your safety stock as a "set-it-and-forget-it" number is a classic mistake. Things change too fast for that.
A good rule of thumb is to review and potentially recalculate your levels quarterly, or at a minimum, twice a year. If you're in a fast-moving industry like fashion or electronics, a monthly review is much safer.
You should also recalculate immediately if certain things happen:
This is an excellent question because the two are tightly linked but serve totally different functions.
Think of it like this: safety stock is your cushion, while the reorder point is your trigger.
Safety stock is the extra inventory you hold just in case things go wrong. The Reorder Point is the specific inventory level that tells you it's time to place a new order. Your safety stock is actually a core piece of that calculation:
Reorder Point = (Average Daily Sales × Average Lead Time) + Safety Stock
Basically, you trigger a new order when you have just enough stock left to cover sales during the shipping lead time, plus your safety buffer.
You can, but it’s a terrible way to manage your cash. Applying a blanket service level—say, 99%—to every single product means you'll inevitably over-invest in slow-moving or low-margin items. Your cash will be tied up in products that aren't pulling their weight.
A much smarter approach is using ABC analysis to segment your products.
This tiered method protects your most important revenue streams without sinking unnecessary capital into the products that don't move the needle.
Inconsistent lead times are a huge headache, especially for Shopify stores. The first, most immediate step is to make sure you're using a safety stock formula that explicitly accounts for lead time variability. This will at least give you a mathematical buffer for the risk you're facing.
But that's just a defensive move. The real solution is to tackle the root cause.
Start a direct conversation with your supplier about their performance. See if you can establish service level agreements (SLAs) to create some accountability. At the same time, it's always wise to identify and qualify a backup supplier. This not only gives you a plan B but also gives you more leverage with your primary partner.
Ready to move past manual calculations and get dynamic, AI-powered safety stock recommendations for your entire catalog? Tociny.ai connects to your Shopify store to provide real-time inventory insights and adaptive forecasts, helping you eliminate stockouts and free up cash. Explore Tociny.ai and join our private beta for early access.
Tociny is in private beta — we’re onboarding a few select stores right now.
Book a short call to get early access and exclusive insights.