
At its core, an inventory spreadsheet is just an itemized list of every product you have in stock. But for a Shopify merchant, it’s so much more. It's the first real step toward gaining control over your sales, dodging costly stockouts, and making smarter purchasing decisions. Think of it as the foundation for true inventory mastery.
With all the sophisticated software out there, why bother with a "basic" spreadsheet? The answer is simple: it forces you to understand the fundamentals of your own business. Before you can let automation and AI take the wheel, you need to learn how your inventory actually behaves. A spreadsheet is the perfect classroom for that.
A well-built sheet is way more than a product list. It's your command center, giving you a real-time snapshot of your business's health. You can see exactly where your cash is tied up, which products are flying off the shelves, and which ones are just gathering dust.
Trying to manage inventory without a clear system feels like fumbling around in the dark. A good spreadsheet flips the lights on. By putting all your critical data in one place, you stop guessing and start making decisions based on cold, hard facts.
This direct line of sight helps you:
This level of control isn't just a nice-to-have; it's critical. The global inventory management software market hit USD 3.9 billion in 2024 for a reason—businesses are desperate for real-time visibility. Yet, many mid-sized retailers still report 20-30% stockout rates when they rely on messy manual tracking. That gap shows the difference between just listing products and strategically managing them. You can find more insights on the inventory management software market here.
A spreadsheet doesn't just track what you have; it tells the story of how your products move. Learning to read that story is the difference between reacting to problems and preventing them entirely.
Ultimately, mastering your inventory spreadsheet gives you the foundational knowledge to scale your business. It builds the discipline and deep understanding you need before an AI tool like Tociny.ai can come in and truly supercharge your efforts.
Think of your master inventory spreadsheet as the blueprint for your entire operation. Every column has a job to do, and when you set it up right, the whole system just works. This isn't just a list of products; it's the single source of truth that will drive your buying decisions, financial planning, and growth. Let's walk through how to build this thing from the ground up, column by column.
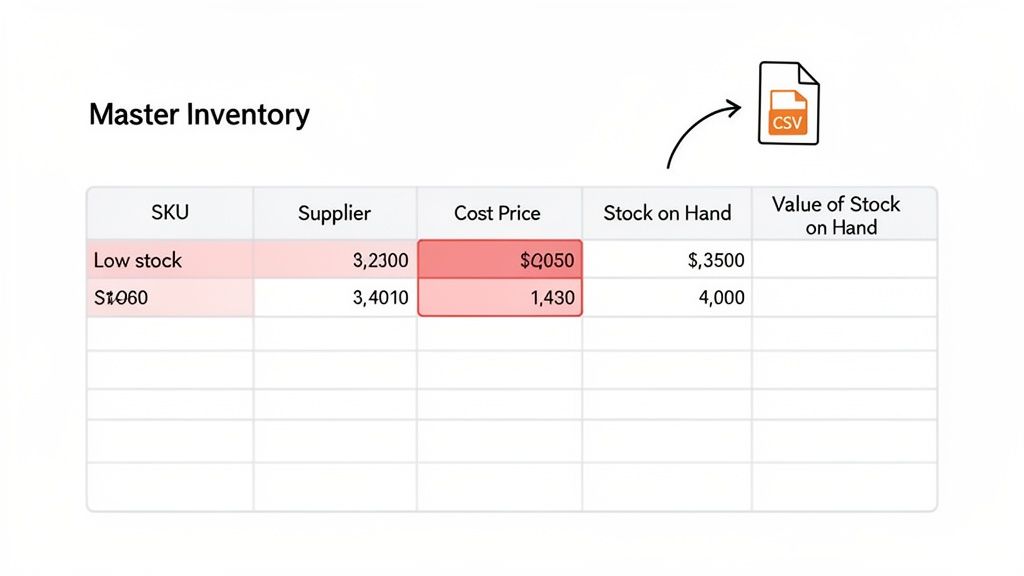
First things first, you need to get your product data into the sheet. The quickest way to do this is by exporting a CSV file right from Shopify. This pulls all your crucial product info—SKUs, titles, current stock levels, you name it—into a file you can pop open in Google Sheets or Excel. Trust me, this will save you from hours of mind-numbing data entry.
Once you have that data, you can start organizing it into a flow that turns raw numbers into real strategy. A well-built spreadsheet gives you clear visibility, which is your best defense against tying up cash in overstock or losing sales to stockouts.
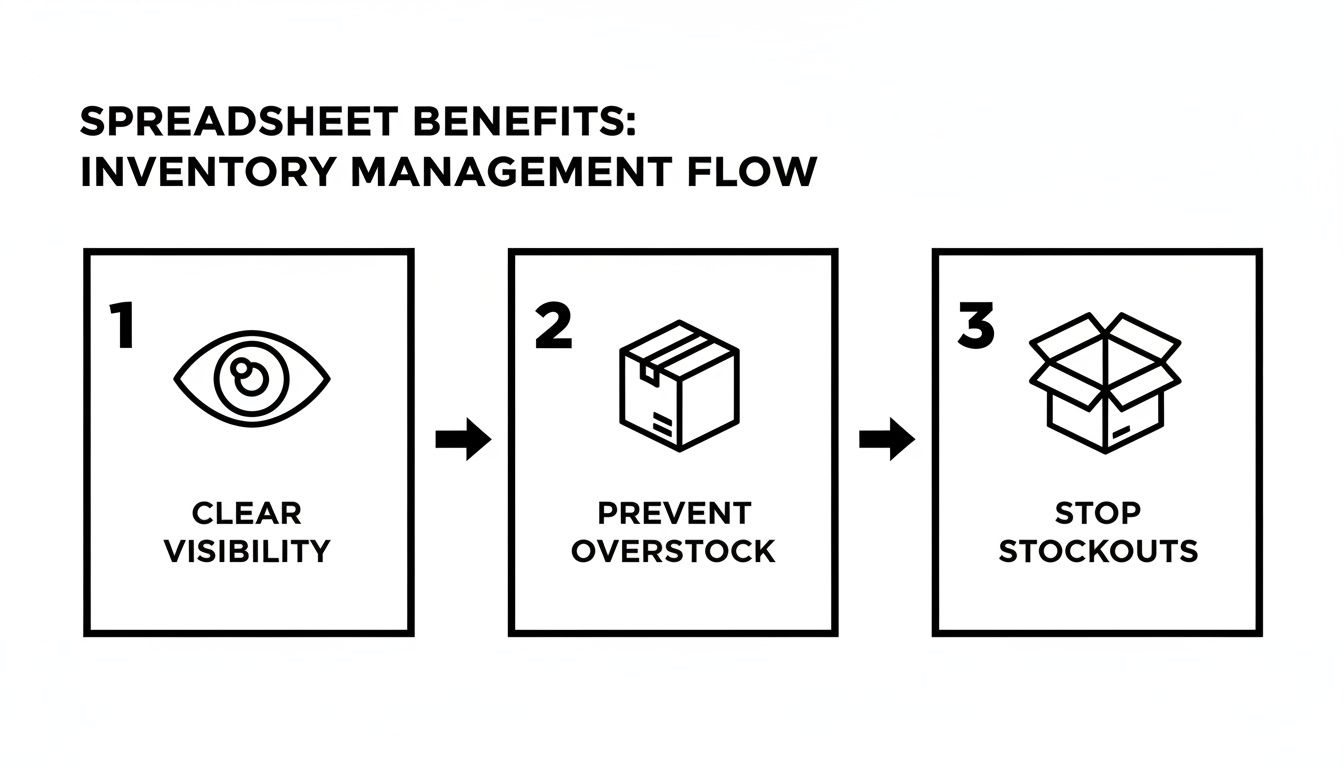
This simple idea is the core of it all: good data leads to good decisions. You'll stop guessing and start knowing exactly what's happening with your inventory.
Before you get fancy with formulas, you need a rock-solid foundation. These are the non-negotiable columns that form the bedrock of your inventory tracking. They're the vital stats for every single item you sell.
Here's a breakdown of the must-have columns, their purpose, and an example for each to help you structure your master inventory sheet effectively.
| Column Name | Purpose | Example |
|---|---|---|
| SKU (Stock Keeping Unit) | The unique ID for each specific product variant. This is the most critical field for accurate tracking. | TSHRT-BLK-M |
| Product Name | A clear, human-readable name for the product. Makes the sheet easy to scan. | Classic Crew Neck T-Shirt - Black |
| Variant | Specifies the unique attributes of a product, like size or color. | Medium |
| Supplier | Who you buy the item from. Absolutely essential for reordering. | Acme Apparel Co. |
| Cost Price (Per Unit) | What you pay your supplier for one item. This is the key to calculating profit margins. | $8.50 |
| Stock on Hand | The current quantity of this item you physically have in your warehouse. | 112 |
| Committed Stock | The number of units that have been sold but not yet shipped. | 15 |
| Available Stock | The actual number of units you can sell right now. (Stock on Hand - Committed Stock). |
97 |
Getting these columns right is the first major step. You might also find that as your store grows, you'll need to account for more complex fulfillment, and knowing how third-party logistics business storage solutions work can help you adapt your spreadsheet design for multi-location tracking.
Okay, with the basics locked in, it's time to make your spreadsheet smart. By adding a few columns that use simple formulas, you can turn your static list into a dynamic dashboard that gives you instant insights.
One of the most powerful calculated columns you can add is Value of Stock on Hand. This tells you exactly where your money is sitting. The formula couldn't be simpler:
= [Stock on Hand] * [Cost Price]
Drag that formula down for every row, and you’ve just calculated the dollar value of every single item in your inventory. Sum up that column, and you get your total inventory value—a critical number for your financial health. If you want to get deeper into organizing your sheet, we have a whole guide on how to format a sample Excel sheet for better clarity.
But here’s a real game-changer: conditional formatting.
Use conditional formatting to make your 'Available Stock' column automatically turn red when it drops below your reorder point. This simple visual cue is impossible to miss and turns your spreadsheet from a passive document into an active alert system.
This one trick can almost single-handedly prevent stockouts on your bestsellers. You see red, you reorder. It’s that simple. By combining your core data with smart formulas and formatting, your spreadsheet stops being a chore and becomes one of your most valuable management tools.
An inventory spreadsheet filled with just product names and SKUs is a start, but it's not giving you the whole story. The real magic happens when you plug in a few key formulas. These calculations are what transform your static list into a dynamic decision-making tool, telling you not just what you have, but what you need to do next.
This is how you get a real handle on your cash flow and keep customers from seeing that dreaded "out of stock" message.
Let's walk through the three core metrics every Shopify merchant should have on lock. Getting these right is the difference between simply tracking stock and strategically managing it for growth.
First up is the Inventory Turnover Rate. This number is your pulse check—it tells you how quickly you’re selling through your entire inventory over a set period. A high turnover rate is usually a great sign, pointing to healthy sales and efficient management. A low rate, on the other hand, might be a red flag for overstocking or products that just aren't moving.
To get this number, you only need two pieces of data: your Cost of Goods Sold (COGS) and your Average Inventory Value.
The formula itself is pretty simple: Inventory Turnover Rate = COGS / Average Inventory Value. If your result is 4, it means you sold and replaced your entire inventory four times that year. Not bad.
While turnover shows you the speed, Days of Inventory tells you how long your current stock will actually last. This is absolutely critical for planning your cash flow, as it highlights how many days your capital is tied up in products sitting on a shelf.
The good news is that this formula builds directly on your turnover rate: Days of Inventory = 365 / Inventory Turnover Rate.
So, using our previous example where the turnover rate was 4, your Days of Inventory would be 365 / 4 = 91.25 days. This tells you that, on average, it takes about 91 days to sell through your stock. That's a powerful piece of information when you're setting sales goals or juggling payment schedules with suppliers.
A common mistake is calculating these metrics for your entire business at once. For truly actionable insights, calculate turnover and days of inventory for individual product categories—or even specific SKUs—to identify your true winners and losers.
Think of the Reorder Point (ROP) formula as your frontline defense against stockouts. It pinpoints the exact stock level that should trigger a new purchase order, ensuring you get fresh inventory before you run out.
At its most basic, the formula is: Reorder Point = (Average Daily Unit Sales × Lead Time in Days).
But here's the thing: that simple version doesn't account for real-world chaos like a sudden spike in demand or a supplier delay. This is where safety stock becomes your best friend, creating a reliable buffer for the unexpected. A solid reorder point is a cornerstone of good inventory management, and you can learn more about how to calculate safety stock to really dial in your formula.
The market is clearly shifting toward smarter, more efficient operations. By 2025, it's expected that AI-integrated tools will slash overstock by up to 25% through better forecasting. This move away from clunky spreadsheets reflects a huge opportunity to avoid the staggering $1.1 trillion that inventory mismanagement costs businesses every year.
Now that your formulas are humming along, your inventory spreadsheet is more than just a list—it's a command center. Let's use it to solve one of the biggest challenges for any Shopify store: a catalog full of products with wildly different performance.
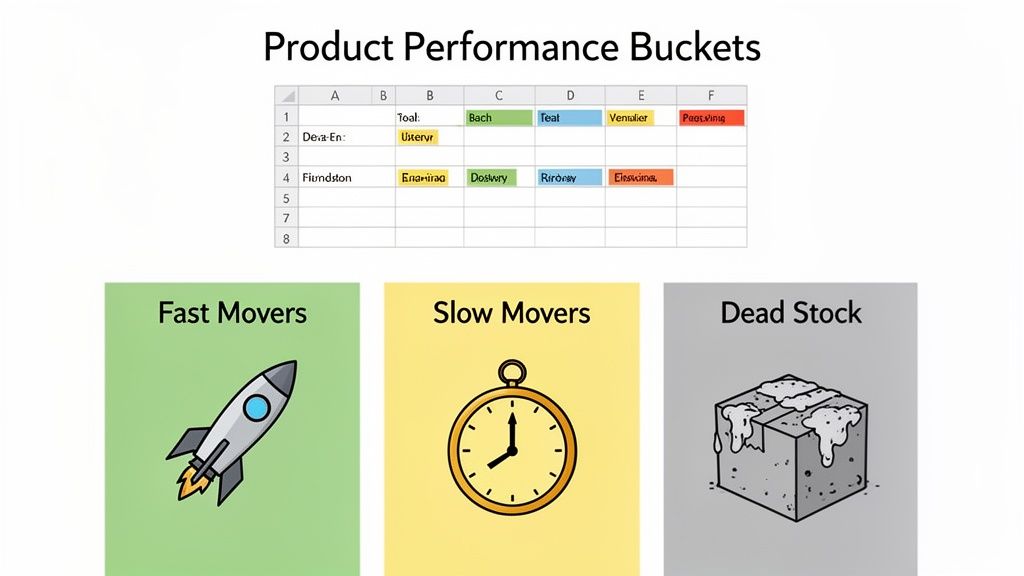
It's a simple truth of ecommerce: not all products are created equal. Some items fly off your digital shelves, some meander, and a few just sit there, hogging cash and collecting dust. By sorting these products into clear performance categories, you can stop guessing and start making targeted, profitable decisions.
The first move is to categorize your inventory into three buckets. It's as simple as adding a new column to your sheet—call it "Performance Category"—and then using your sales data and inventory turnover rates to label each product.
Imagine you run a home goods store. That popular lavender-scented candle that sells hundreds of units a month? That's a Fast Mover. The quirky, niche decorative vase that sells a few times a quarter? A classic Slow Mover. And that holiday-themed serving platter from last year that hasn't moved since January? Pure Dead Stock.
Once everything is labeled, you can build a specific strategy for each group to boost your bottom line. This is where your spreadsheet truly becomes a strategic asset.
For your Fast Movers, the name of the game is availability. You simply can't afford to run out of your most popular products. Go back and double-check your reorder points, making sure you have enough safety stock to handle a sudden surge in demand or a delay from your supplier. These items are proven winners—keep them in stock at all costs.
For your Slow Movers, the mission is to increase sales velocity. Get creative. Try bundling a slow mover with a fast mover to make it more attractive. You could also run a targeted promotion, offer a slight discount, or give the product page a facelift with better photos and a more compelling description. Sometimes all it needs is a little nudge to get moving again.
For your Dead Stock, the objective is simple: liquidation. Your only goal is to free up the cash tied up in these dust-collectors. Run a steep flash sale, offer them as a free gift with a minimum purchase, or even sell them as a bulk lot to a liquidator. Holding onto them just costs you more in the long run.
This kind of hands-on management is what separates thriving stores from struggling ones. Manual spreadsheets often lead to significant overstock, a problem that’s especially painful in volatile markets like fashion and electronics. It's a huge issue, which is why the inventory optimization software market is projected to hit USD 5.87 billion by 2025.
While AI-powered tools like Tociny.ai are built to automate these kinds of recommendations, understanding the fundamental logic in a spreadsheet is an invaluable skill. You can learn more about the trends shaping the inventory optimization market to see where things are headed.
That inventory spreadsheet you've painstakingly built? It’s a fantastic tool. It gives you a real sense of control and a clear view of what’s happening in your business right now. But as your Shopify store scales, the very manual work that gave you that clarity can start to become an anchor.
The hours spent plugging in sales numbers, triple-checking formulas, and hunting down typos start to feel less like management and more like a chore. This is the natural ceiling of any spreadsheet. It's a reactive tool that's only as good as the last piece of data you fed it.
When your catalog balloons or you’ve got a flash sale that blows up, the risk of a simple human error multiplies. I've seen it happen: a single typo in a reorder point formula leads to a surprise stockout on a bestseller. The cost isn't just lost sales—it's lost customer trust.
So, how do you know when you’ve officially outgrown your spreadsheet? The signs are usually pretty obvious and almost always frustrating. They show up as friction in your daily operations and opportunities you know you're missing.
Look for these common growing pains: * You're a professional data-enterer. You or your team spend several hours every single week just keeping the sheet alive—logging sales, updating stock levels, and adjusting formulas. * Stockouts and overstocks are still happening. Despite all your hard work, you’re still surprised by what’s flying off the shelves and what’s collecting dust, leading to either lost revenue or cash tied up in dead stock. * You're flying blind into the future. Your spreadsheet is great at telling you what happened yesterday. It’s terrible at predicting what your customers will want next month, turning your purchasing into a high-stakes guessing game.
Here's the bottom line: if you're spending more time managing the data than acting on it, you've hit the limit. The goal isn't just to track inventory. It's to optimize it for profit, and that means looking forward.
Moving from a manual spreadsheet to an AI-powered platform like Tociny.ai isn't about throwing away all that knowledge you’ve gained. It's about putting it on steroids.
AI takes over the tedious tasks you’ve been doing by hand—calculating turnover rates, forecasting future demand, and setting dynamic reorder points. The difference is, it does it with a level of predictive accuracy and speed that a spreadsheet just can't compete with. If you want to peek under the hood at how this works, our guide on demand forecast methods breaks down the models that power these systems.
Of course, any new tool is an investment. It's smart to weigh the costs against the benefits, and a detailed breakdown like this one on Automation Costs Vs. Benefits: Finding The Balance can help you frame that decision.
The entire logistics automation market is exploding for a reason. The inventory management segment alone is projected to hit USD 5,698.8 million by 2033. This isn't just a trend; it's a fundamental shift away from static spreadsheets toward dynamic, automated systems that can keep up with the pace of modern e-commerce. Tociny.ai was built to be that next logical step, turning the historical data you've been collecting into a powerful engine for future growth.
Managing inventory day-to-day always sparks a few questions. Getting the details right is the difference between a spreadsheet that’s a genuine asset and one that just creates more headaches. Let's dig into some of the most common things Shopify merchants ask.
People often start by looking for the perfect free template. But honestly? The single best inventory spreadsheet template is the one you build for your own business, just like we’ve walked through. No generic download will ever get the nuances of your product mix, your suppliers, or your unique sales cycle.
For this to work, your spreadsheet needs to be a living document—not some static report you glance at once a month. To get reliable data you can actually trust, you need to be logging all sales and incoming stock daily. This is the only way to keep your "Stock on Hand" numbers truly accurate.
Beyond the daily updates, you’ll want to do a full physical stock count (or cycle count) either weekly or bi-weekly. This catches any discrepancies before they become huge problems.
Consistency is everything. An outdated inventory spreadsheet is worse than having no sheet at all because it forces you to make decisions based on bad information. Daily check-ins stop small errors from snowballing.
Absolutely, and for most Shopify stores, it's non-negotiable. The trick to tracking products with different sizes, colors, or styles is to treat every single variant as its own unique product. That means each one gets its own dedicated row in your spreadsheet.
The key is assigning a distinct SKU (Stock Keeping Unit) to every last variant. For example, a medium black t-shirt needs a different SKU than the large version.
By giving each variant its own SKU and row, you get precise, granular tracking. This is how you avoid that sinking feeling when you think you have plenty of t-shirts, only to find out you're completely sold out of the most popular size.
Ready to stop reacting and start predicting? Tociny.ai uses AI to automate inventory forecasting, giving you clear recommendations to prevent stockouts and cut down on overstock. It’s time to take the guesswork out of your planning and scale smarter. See how it works at https://tociny.ai.
Tociny is in private beta — we’re onboarding a few select stores right now.
Book a short call to get early access and exclusive insights.