Let's be real: calculating safety stock is more than just plugging numbers into a formula. At its core, it's about creating a strategic buffer—that extra inventory you keep on hand to shield your business from the chaos of unexpected demand spikes and pesky supplier delays. It's what ensures you can always say "yes" to your customers.
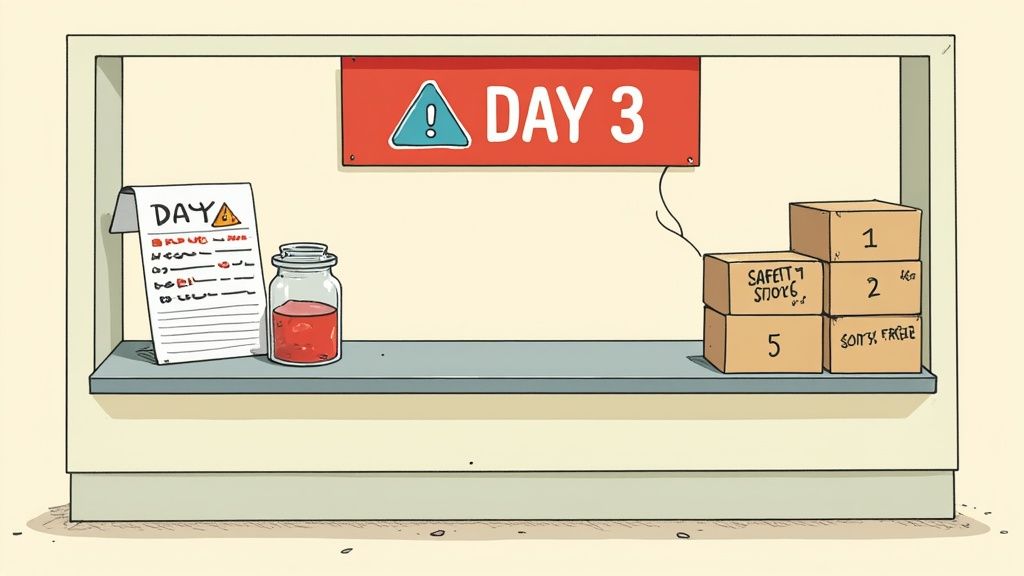
Picture this: you've just launched a massive promotion for your top-selling product. The ads are killing it, and orders are flying in. But by day three, your inventory is bone dry. To make matters worse, a simple delay from your supplier means you're stuck for another week. This isn't just about lost revenue; it's about broken promises and a reputation on the line.
This is exactly where safety stock stops being a boring inventory metric and becomes one of your most powerful strategic assets.
A well-calculated safety stock is your ultimate defense against the wild unpredictability of the market. It’s the critical line between a minor hiccup and a full-blown crisis that sends your hard-won customers straight to your competitors. Failing to have this buffer leads directly to stockouts, and understanding the true impact of going out of stock is the first step toward appreciating why this buffer is so non-negotiable. For a deeper dive, check out our guide on the real costs of a https://tociny.ai/blog/stock-outs-definition.
The fallout from poor planning goes way beyond that initial lost sale. When a popular item is unavailable, you kick off a ripple effect that damages multiple parts of your business. These hidden costs add up fast:
Safety stock isn't just about having extra product lying around. It's a calculated investment in customer satisfaction, operational stability, and brand resilience. It helps you turn unpredictability into a manageable variable.
One of the biggest mistakes I see is businesses treating safety stock like a one-size-fits-all formula. The reality is, you need a whole toolkit of methods you can adapt to your specific products and challenges. The right calculation always comes down to a few core drivers:
This guide will walk you through the different ways to calculate safety stock, helping you pick the right approach for your unique situation. To see how this fits into the bigger picture, it’s helpful to understand broader inventory management best practices.
Jumping into safety stock formulas without the right data is a classic recipe for disaster. Garbage in, garbage out, as they say. The quality of your calculation is only as good as the numbers you feed it, so getting a handle on these three components is non-negotiable.
Think of them as the foundational pillars of your inventory strategy. Get them right, and your safety stock becomes a sharp, responsive tool. Get them wrong, and it’s just a blunt instrument that either costs you a fortune in carrying fees or fails to protect you when you need it most.
First up, and arguably most important, is understanding just how much your customer demand bounces around. You can't protect against volatility if you can't measure it. This means diving into your historical sales data to find two key figures: average daily demand and the standard deviation of demand.
Average daily demand is simple enough—it’s the typical number of units you sell each day over a given period, say the last 90 or 180 days. The standard deviation, however, is what really quantifies your risk. It measures how much your daily sales tend to stray from that average. A low standard deviation signals stable, predictable sales, while a high one screams erratic demand that calls for a much bigger safety buffer.
Good safety stock calculations depend on good demand variability data, which relies heavily on accurate inventory forecasting. For a deeper look into the various techniques available, you can explore different demand forecast methods in our detailed guide.
Next, you need to turn a critical eye toward your suppliers. Lead time is the clock that starts the moment you place a purchase order and stops when the goods hit your warehouse floor. But just like demand, lead time is rarely a fixed number. Supplier delays, shipping snags, and customs hold-ups are all part of the game.
To account for this, you absolutely have to measure:
Track every single purchase order and log the actual receipt date. If your supplier promises delivery in 14 days but frequently takes 18, that four-day variance is a risk you must bake into your calculations. You'll quickly find that consistently reliable suppliers are worth their weight in gold because they let you keep safety stock levels lean.
Finally, you need to define your desired service level. This isn't just a mathematical input; it's a strategic business decision. It represents the percentage of customer orders you aim to fulfill from your existing stock without any delay. A 95% service level means you're aiming to have the product on hand 95% of the time, accepting a 5% risk of stocking out.
A higher service level creates a better customer experience, but it always comes at the cost of a larger investment in safety stock. It's a direct trade-off between carrying costs and stockout risk.
And remember, not all products are created equal. You shouldn't apply a blanket service level across your entire catalog. Your best-selling, high-margin "A-items" might warrant a 98% service level, while your slow-moving "C-items" could be perfectly fine at 85%. This segmented approach allocates your capital much more intelligently.
To plug this into a statistical formula, you'll need to convert your service level percentage into a Z-score (also known as a service factor).
Here’s a quick reference table to find the right Z-score for your desired service level. These values are standard in statistics and are essential for any formula that uses standard deviation.
| Desired Service Level (%) | Z-Score (Service Factor) |
|---|---|
| 90% | 1.28 |
| 95% | 1.65 |
| 98% | 2.05 |
| 99% | 2.33 |
Simply find your target service level in the left column and use the corresponding Z-score on the right in your calculations. The higher the Z-score, the more safety stock the formula will recommend holding.
Alright, you've done the hard work of gathering your key inputs—demand variability, lead time, and your target service level. Now it's time to put those numbers to work.
When it comes to inventory management, there's no magic bullet. The formula you choose to calculate safety stock can make a massive difference, directly impacting your cash flow on one end and your customer happiness on the other.
Think of it this way: selecting the right method comes down to your business's reality. Are your suppliers rock-solid but your customer demand is all over the place? Or are you just launching a new product with zero historical data to lean on? Each scenario calls for a different tool from the inventory toolkit. Let's break down the most common formulas and, more importantly, figure out when to use each one.
This decision tree gives you a quick visual guide for matching your business situation to the right formula.
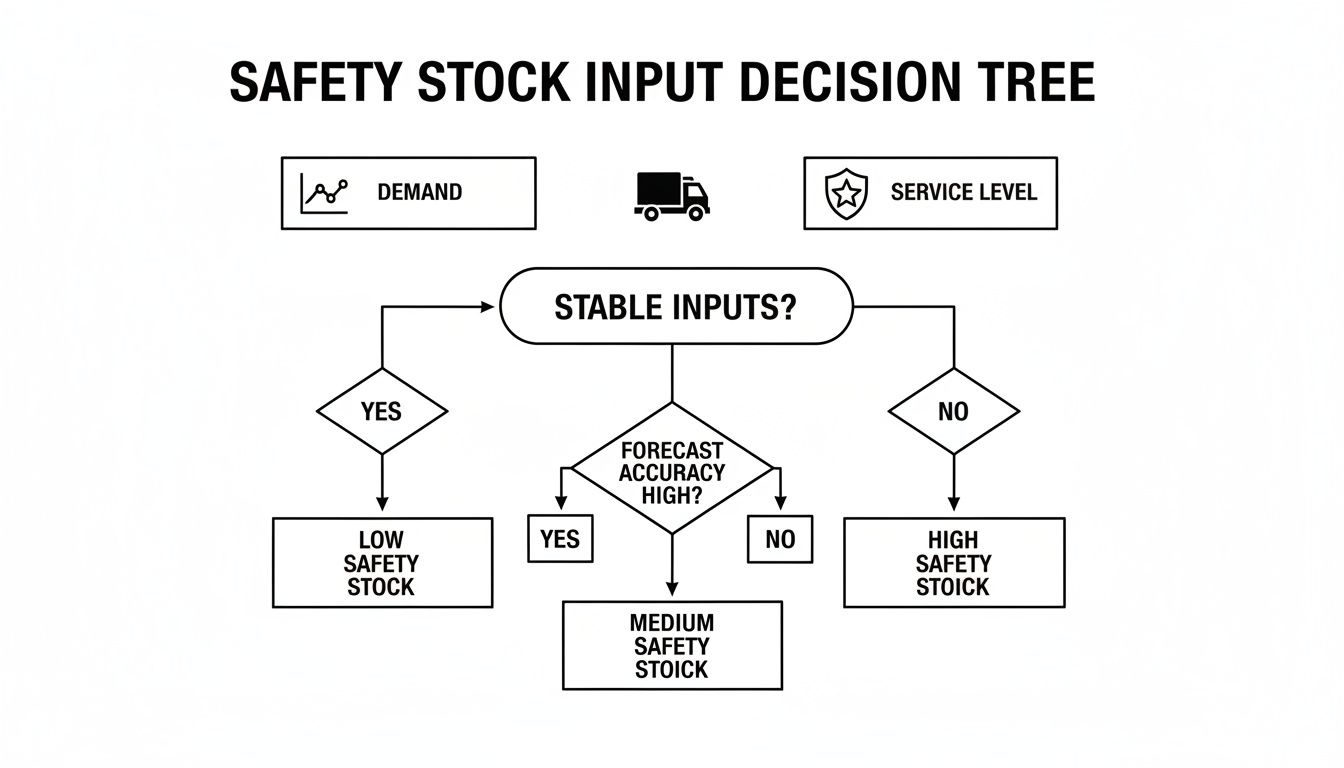
As you can see, it really boils down to how stable and predictable your demand and lead times are. The more volatility you have, the more sophisticated your formula needs to be.
First up is the most straightforward approach, often called the Average-Max method. This one is a fantastic starting point if you're working with limited sales data or if your business operates in a super stable environment where big swings are rare. It's built to protect you against a historical worst-case scenario.
The logic is beautifully simple: figure out the most you could possibly sell during the longest possible lead time, then subtract your average usage. Whatever is left over becomes your safety buffer.
The formula looks like this:
Safety Stock = (Maximum Daily Sales × Maximum Lead Time) – (Average Daily Sales × Average Lead Time)
This old-school method, sometimes called the "prudent father" approach, uses past extremes to guard against the worst plausible combination of supply and demand issues. It became a standard back when calculations were done by hand, ensuring businesses were covered for peak sales spikes that coincided with the longest supplier delays. A 2015 study of 500 European distributors showed this approach helped them maintain 92% fill rates while keeping inventory costs to just 15% of total logistics expenses. For a deeper dive into this classic method, you can discover more insights about safety stock calculations on abcsupplychain.com.
Key Takeaway: The Average-Max method is your go-to for a quick, conservative safety stock calculation. It values simplicity and protection against historical extremes over granular statistical precision.
Let’s walk through a quick example. Imagine you sell artisanal coffee beans online.
Plugging those numbers into the formula:
Safety Stock = (40 bags × 10 days) – (25 bags × 7 days) Safety Stock = 400 – 175 Safety Stock = 225 bags
This tells you to keep an extra 225 bags of coffee on hand to safely cover potential demand spikes and supplier delays, based on what you've seen in the past.
While the Average-Max method has its place, most established businesses need something more refined. That's where the standard deviation method comes in. It’s the industry standard for a good reason: it uses real statistics to directly connect your safety stock to your desired customer service level.
Instead of just eyeballing historical extremes, this method actually quantifies the variability in your demand. It then uses a Z-score to build a buffer that perfectly aligns with your strategic goals.
The most common version of this formula focuses purely on demand variability, assuming your lead time is relatively consistent.
Safety Stock = Z-Score × Standard Deviation of Demand × √Average Lead Time
What I love about this formula is that it creates a statistically sound buffer. It automatically ensures that the more volatile a product's sales are, the more safety stock you carry. It’s a much smarter way to invest your inventory capital.
Let's apply this to a real-world scenario. Picture an e-commerce store selling a popular skincare serum.
Now, let's do the math:
Safety Stock = 2.05 × 15 units × √9 Safety Stock = 2.05 × 15 × 3 Safety Stock = 92.25 units (so we'll round up to 93 units)
This means the store should keep 93 extra units on hand. That buffer is statistically designed to help them hit their goal of fulfilling 98% of customer orders on time, even with their typical demand swings.
So, what happens when both your demand and your supplier lead times are all over the map? This is the unfortunate reality for many businesses dealing with today's complex global supply chains. If you only account for demand swings, you're leaving yourself completely exposed to unexpected supplier delays.
For these volatile situations, you need the most robust formula in the toolkit: one that accounts for the combined variability of both demand and lead time. This is the gold standard for any business operating in an unpredictable environment.
The formula looks a bit intimidating at first, but the idea is the same—it just measures the total uncertainty you face during your replenishment cycle.
Safety Stock = Z-Score × √((Average Lead Time × σD²) + (Average Demand² × σLT²))
Where:
This calculation builds a comprehensive buffer that protects you from both customer demand spikes and unreliable supplier performance at the same time.
Using this formula prevents you from getting caught off guard. It ensures your safety stock can handle the perfect storm: a sudden surge in orders hitting right when your supplier has an unexpected delay. For many online sellers, that's not a hypothetical—it's a recurring nightmare. This formula is the ultimate tool for turning two major uncertainties into one manageable number.
Let's be honest, the top-performing companies aren't just guessing their inventory levels—they're calculating them with incredible precision. Moving beyond the basic formulas and into statistical methods isn't just an academic exercise. It's how you gain a real, measurable advantage in a market that's more crowded than ever.
This is where you make the switch from reacting to supply chain surprises to proactively managing them.
The whole idea is to tie your buffer stock directly to your desired customer service level using what's known as a Z-score. Doing this lets you strategically and confidently trim down excess inventory without jacking up your risk of stocking out. You stop holding inventory "just in case" and start holding the exact right amount to hit your business goals. It’s about being lean, but not fragile.
Now, the real magic happens when you pair these statistical formulas with a classic inventory management technique: ABC analysis. This is all about classifying your products into different buckets based on their value or sales volume. Why? Because not every product deserves the same level of protection.
This simple framework helps you put your money where it delivers the highest return and protects the customers who matter most. You can set different service level targets for each category, fine-tuning your entire inventory investment.
This inventory classification matrix from Netstock gives you a great visual of how you might segment your products.
As you can see, the A-items (high value, high volume) deserve the lion's share of your attention, while C-items (low value, low volume) can be managed with looser controls.
Let's walk through what this looks like in the real world. Imagine you run a Shopify store selling wellness supplements. After running an ABC analysis, you might classify your products like this:
By applying different service levels, you're not just doing math; you're making a conscious business decision. You're deciding which customers and which revenue streams to protect most aggressively.
This strategic segmentation isn't new, but it's incredibly effective. A pharmaceutical distributor, for example, implemented this exact approach back in 2018. The result? They boosted their service levels from 92% to 98.5% while cutting overall inventory by a staggering 14%. That's a massive win.
As leading inventory experts will tell you, this tiered approach is a global best practice. If you want to dig deeper, you can explore the guidelines used by over 1,000 firms on Netstock.com.
Running your safety stock numbers for the first time is a massive win. But here’s the thing: those numbers are not a "set it and forget it" solution. I’ve seen countless businesses make this costly mistake, treating their inventory levels as static figures.
True inventory optimization is a living, breathing process. The goal isn’t just to calculate a number; it's to build a responsive system. Your safety stock levels need to flex and adapt to new sales trends, shaky supplier performance, and your own business goals. Think of it less as a one-time project and more as a continuous tuning process.
First things first, you need to establish a consistent review schedule. Leaving your safety stock numbers untouched for a whole year is a surefire way to either bleed cash on excess inventory or face those dreaded out-of-stock notices.
So, how often should you check in? It really depends on the product.
For most of your inventory, a quarterly review is a great starting point. It’s frequent enough to catch significant shifts in demand or lead times without burying you in administrative work.
But your best-sellers? They need a closer watch. For those A-list products that drive the lion's share of your revenue, you should be looking at them monthly. Their high velocity means even a small shift in demand can have a huge impact, so frequent tweaks are crucial. For more on keeping these key items in stock, our guide to the replenishment of stocks has some great strategies.
Beyond a regular schedule, some events should automatically trigger a safety stock review. You have to get ahead of these things and adjust your buffers before they throw your inventory out of whack.
Here are the big ones to watch for:
Think of your safety stock level as a dial, not a switch. You should be constantly turning it up or down in small increments based on the latest data and business intelligence you have.
Let’s be honest, manually crunching safety stock numbers in a spreadsheet for hundreds of SKUs is a nightmare. It’s not just tedious; it’s a breeding ground for human error. This is where modern tools go from being a "nice-to-have" to a necessity.
When you're dealing with variability in both demand and lead time, the most accurate calculations get pretty complex. In fact, post-COVID supply chain analyses have shown that using the right combined statistical formula can cut total inventory by 20-25% while still hitting a 97% service level. This approach captures the joint uncertainty far more accurately, leading to major cost savings in volatile markets.
This is exactly what platforms like Tociny.ai are built for. They hook into your sales data, monitor lead times, and handle all the complex math behind the scenes. By automating the process, you can be confident your safety stock levels are always optimized based on the most current information, keeping your business resilient and ready for whatever comes next.
Putting these formulas into practice is where the real work begins. Let's be honest, inventory management is never as clean as a spreadsheet formula suggests, and knowing how to handle the nuances is what separates a good strategy from a great one. I've pulled together the most common questions that pop up when businesses start getting serious about safety stock.
Think of this as the final piece of the puzzle. These are the insights that will help you navigate the gray areas, sidestep common pitfalls, and feel confident in your approach.
One of the biggest mistakes I see is treating safety stock as a "set it and forget it" number. It's not static. For most products, a quarterly review is a solid baseline, but that's just a starting point. Your review schedule really needs to mirror how fast and how unpredictably a product sells.
But the most important trigger for a recalculation isn't the calendar—it's change. The moment a core input becomes obsolete, you have to run the numbers again.
When a core assumption changes, your numbers need to change with it. Immediately.
There's no single magic number here. The "right" service level is a strategic decision that pits the cost of holding inventory against the risk of losing a sale. It's a trade-off.
For your most critical, high-margin products (your A-items), aiming for 95-98% is a smart move. This is where you protect your core revenue and keep your best customers happy. Don't skimp here.
For your mid-tier products (B-items), a range of 85-95% usually hits the sweet spot between availability and cost. You can stomach a slightly higher risk of a stockout on these.
And for your low-cost, slow-moving items (C-items), you can often drop as low as 80-85%. This frees up cash by preventing you from tying it up in inventory that doesn't move quickly and won't sink your business if it stocks out for a week.
The goal isn't 100% service for everything. That's a recipe for bankruptcy. The goal is to strategically allocate your capital to protect the products that truly drive your business forward.
Technically, yes, but it's a high-wire act that's only suitable for very specific business models. You need to be extremely careful with this.
Products that are 'make-to-order' or part of a true 'just-in-time' (JIT) system are designed from the ground up to operate with little to no safety stock. It's also the default for dropshipping, where you're not holding any inventory in the first place.
But for any product you promise to have on hand for immediate fulfillment? Carrying zero safety stock is playing with fire. The smallest supplier hiccup or a tiny unexpected demand blip will instantly put you out of stock, frustrating customers and sending them straight to your competitors. For most e-commerce businesses managing their own inventory, it's a risk that just isn't worth taking.
Juggling all these variables by hand can get overwhelming, fast. This is where a tool like Tociny.ai can make a huge difference. It automates these complex calculations, constantly analyzing your sales data and supplier performance to recommend optimized safety stock levels. You can stop guessing and start making decisions backed by real data.
Tociny is in private beta — we’re onboarding a few select stores right now.
Book a short call to get early access and exclusive insights.