Demand forecast accuracy is the difference between how much you thought you’d sell and what you actually sold. It's a gut-check metric for any e-commerce brand, showing you in plain numbers how well your inventory plan matches reality. Get it right, and you waste less money. Get it wrong, and you're staring down the barrel of stockouts or warehouses full of dead stock.
Think of it like this: you're planning a massive outdoor event. Forecasting isn't just about guessing if it might rain. It's about predicting exactly how many umbrellas you need to keep everyone dry—without having to haul in a truckload of extras "just in case." For your brand, this means having just the right amount of product on your shelves.
Demand forecast accuracy simply measures how good you were at that prediction. It’s the gap between what you expected customers to buy and what they pulled out their wallets for. The smaller that gap, the healthier your operation.
Chasing 100% accuracy is a fool's errand. It's impossible. The real win is in consistently making that gap between forecast and reality a little bit smaller. Even tiny, incremental improvements in your demand forecast accuracy can unlock huge financial gains. Every percentage point you gain puts real money back into your business.
Just think about the direct results:
"A 1% absolute reduction in average forecast error can translate into lower safety stock requirements, fewer stockouts, and reduced obsolescence."
This isn't just theory. One analysis found that a global hardware company cut its inventory by an estimated 7%, unlocking a potential savings of up to $300 million—all through better forecasting. At its heart, forecast accuracy is about being able to predict when consumers will buy a product, a skill that directly shapes your entire business strategy.
Ultimately, improving your demand forecast accuracy isn't some technical exercise for your inventory manager. It's a core driver of profitability that impacts every corner of your business. It means your marketing dollars are spent promoting products you actually have in stock. It means your customer service team isn't fielding constant complaints about availability.
This metric is a foundational piece of effective demand planning. It's the critical link between your supply chain operations, your brand's financial health, and the promises you make to your customers.
Trying to gauge your demand forecast accuracy without the right metrics is like trying to check your car’s engine temperature with a ruler. You’ll get a number, but it won’t tell you anything useful. Different metrics reveal different parts of the story, and using a smart combination is the only way to get a true picture of your forecast’s health.
Not all errors are created equal. Being off by 100 units on a fast-moving t-shirt that sells thousands a week is a minor blip. But being off by 100 units on a high-end electronic device? That could easily be a five-figure mistake. The metrics you choose have to reflect this kind of business context.
It's not just an operational task; it's a financial lever. Nailing your forecast accuracy directly cuts operational costs and drives up profits, making it a powerful tool for your bottom line.
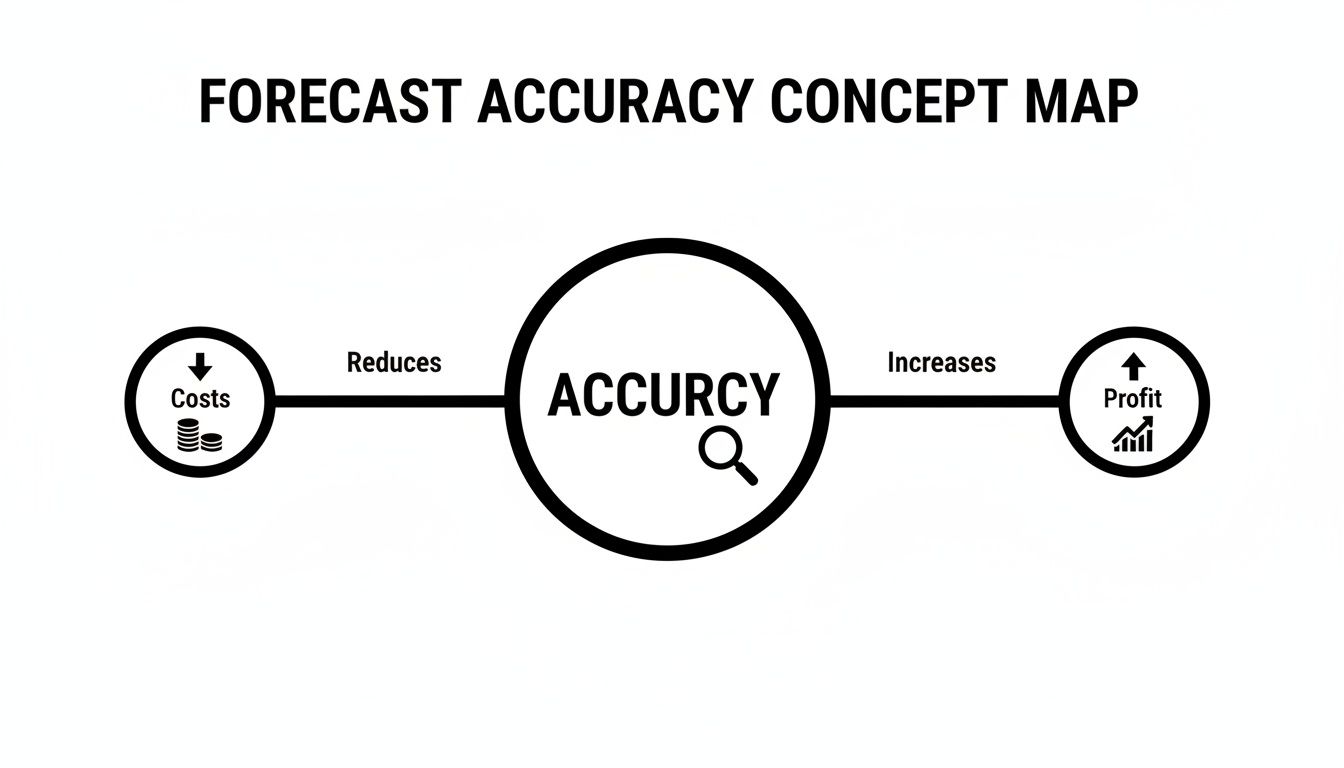
This connection between solid forecasting and financial performance elevates accuracy from a simple KPI to a core strategic goal.
Mean Absolute Percentage Error (MAPE) is one of the most popular metrics out there, and for good reason. It measures the average error as a percentage, which makes it a fantastic tool for comparing forecast performance across your entire product catalog, regardless of sales volume or price.
Think about it: you want to know if your forecast for low-cost accessories is as good as your forecast for expensive winter coats. Because MAPE works in percentages, it puts everything on a level playing field. A 15% MAPE means the same thing for a $10 item as it does for a $100 item.
But MAPE isn't perfect. It has a critical weakness: it completely breaks down for products with zero sales in a given period (you can’t divide by zero, after all). It can also give you some wild, misleading numbers for very low-volume SKUs. An error of just two units on a product you only expected to sell one of results in a massive 200% MAPE.
If MAPE is the equalizer, then Root Mean Square Error (RMSE) is your early warning system for big, costly mistakes. This metric calculates the square root of the average of squared errors. By squaring the errors before averaging them, it disproportionately penalizes large misses.
This makes RMSE incredibly valuable for keeping an eye on your most important products—the ones where a big miss really hurts. A high RMSE value is a red flag, signaling that you have significant, financially impactful errors in your forecast that need immediate attention, even if your overall MAPE looks decent.
Here's a pro tip: If your RMSE is significantly higher than your Mean Absolute Error (MAE), it's a clear sign that you have occasional large, outlier errors in your forecast that are skewing the results.
While MAPE and RMSE tell you about the magnitude of your errors, they don't tell you the direction. Are you consistently over-forecasting or under-forecasting? That’s where Forecast Bias comes in. It’s a simple metric that measures the average error while keeping the positive or negative signs.
A consistently positive bias means you're over-forecasting, which leads to excess inventory, tied-up cash, and mounting holding costs. On the other hand, a consistently negative bias means you're under-forecasting, resulting in stockouts, frustrated customers, and lost sales. Tracking bias is non-negotiable for finding and fixing systemic problems in your forecasting process.
Choosing the right metric depends entirely on what question you're trying to answer. Here’s a quick breakdown to help you decide which tool to pull out of the toolbox.
| Metric | What It Measures | Best For | Key Consideration |
|---|---|---|---|
| MAPE | Average percentage error, independent of volume. | Comparing accuracy across a wide range of products (e.g., high-volume vs. low-volume). | Can be skewed by low-volume items and doesn't work for products with zero sales. |
| RMSE | The square root of the average of squared errors. | Flagging large, costly forecast misses, especially for high-value "A" items. | Very sensitive to outliers; a few big errors will dramatically increase the value. |
| MASE | Error relative to a simple naive (e.g., last period's sales) forecast. | Evaluating forecast performance for seasonal or intermittent-demand products. | More complex to calculate and can be harder to explain to non-technical stakeholders. |
| Bias | The average direction of the forecast error (positive or negative). | Identifying systemic issues like consistent over- or under-forecasting. | Doesn't measure the magnitude of the error, only the tendency or direction. |
Ultimately, a balanced approach is best. Most savvy inventory planners rely on a combination, often using MAPE for a high-level view of percentage error while closely tracking forecast bias to catch those systemic tendencies. According to established forecasting measurement conventions on Monitask.com, this kind of multi-metric dashboard—factoring in the correct lead-time offsets—is key. It ensures you see the full picture: not just how far off you are, but in which direction, and just how costly those errors truly are.
"What's a 'good' demand forecast accuracy score?" It's one of the first questions every inventory planner asks, and the answer is almost always: it depends. If you're chasing one universal accuracy number across your entire business, you're not just being unrealistic—you're making a strategic mistake.
Let's be clear: a perfect forecast is a fantasy. The real goal is to set smart, context-aware targets that reflect how each product actually behaves in the wild. A high-volume, evergreen product that sells like clockwork should have a very different accuracy goal than a trendy, seasonal item you’re launching for the first time.
Slapping a blanket 85% accuracy target on every single SKU is a recipe for pure frustration. This approach completely ignores that predictability varies wildly from one product to the next. You end up wasting time and energy trying to perfect the forecast for a volatile, low-margin item, while a huge error margin on a core bestseller leads to painful stockouts or cash-draining overstock.
The key is to set tiered goals. You need to look at a product's lifecycle stage, its sales velocity, and how important it is to your bottom line. This lets you focus your forecasting efforts where they’ll actually make a difference financially.
Think about it this way:
While your goals have to be tailored to your business, it helps to know what’s typical out there. Across the industry, planners often use weighted Mean Absolute Percentage Error (wMAPE) to get a sense of performance.
Generally, you'll see mature, high-volume products in stable categories hover between a 10%–15% wMAPE. But for industries like fashion and apparel—driven by seasons and trends—that range jumps to 25%–40%. And for new product launches? Seeing an error rate over 50% is completely normal. If you want to dive deeper, you can explore more about how historical data impacts demand estimation on WareIQ.com.
By segmenting your products and setting realistic, tiered accuracy goals, you stop playing a frustrating guessing game. Instead, forecasting becomes a powerful strategic tool. It helps you celebrate the right wins and focus your energy where it truly matters.
Ultimately, setting the right goals is about understanding the DNA of your products. It’s about recognizing that a 15% error on your hero product is a problem you need to solve, while a 40% error on a risky new launch is just a valuable piece of data for next time. This nuanced approach is how you build an inventory strategy that's more resilient, profitable, and keeps your customers happy.
Knowing the theory behind accuracy metrics is great, but the real magic happens when you start putting them to work. The good news? You don't need a fancy, expensive software suite to get started. You can begin calculating and tracking your demand forecast accuracy right now with tools you already use, like Google Sheets or Microsoft Excel.
Let's walk through building a simple, SKU-level calculation. The goal here isn't just to spit out a single number. It's to build a system that tells you a story about the health of your inventory—a story that helps you spot bad trends, flag problem products, and ultimately, make much smarter POs. For anyone wanting to level up their spreadsheet game, getting a handle on key Excel financial functions can be a massive help for modeling e-commerce data.
Weighted Mean Absolute Percentage Error, or wMAPE, is the perfect metric to start with. Why? Because it automatically focuses your attention on the products that actually move the needle for your business. It weights the accuracy score by sales volume, so a huge miss on your top-selling SKU hurts your score a lot more than a miss on a product that barely sells.
Here’s a quick guide to calculating it for a single product over a specific timeframe:
=ABS(Actual Sales - Forecasted Sales).=SUM(Absolute Error) / SUM(Actual Sales). Make sure to format that cell as a percentage.That final percentage is your wMAPE. A lower number is always better—it means your predictions were closer to what actually happened.
A one-time wMAPE score is just a snapshot. The real power comes from tracking this metric over time to see if you're getting better or worse. By building a simple dashboard, you can turn all those raw numbers into insights you can actually use. It lets you see your performance at a glance and spot trouble before it gets out of hand.
Your dashboard should instantly answer three critical questions:
=(SUM(Forecasted Sales) - SUM(Actual Sales)). If the number is always positive, you're over-forecasting and tying up cash in stock. If it's always negative, you're under-forecasting and leaving money on the table with stockouts.If you want to get more sophisticated with the forecasts themselves, our guide on different demand forecast methods is a great place to explore more advanced modeling techniques.
A good forecast accuracy dashboard isn't just about reporting numbers; it's about provoking questions. If you see a sudden drop in accuracy, the immediate follow-up should be, "What happened that month? Was it a flash sale we didn't account for? Did a competitor launch a big campaign?"
Here’s what a simple but powerful dashboard could look like, pulling together your key charts and metrics in one place.
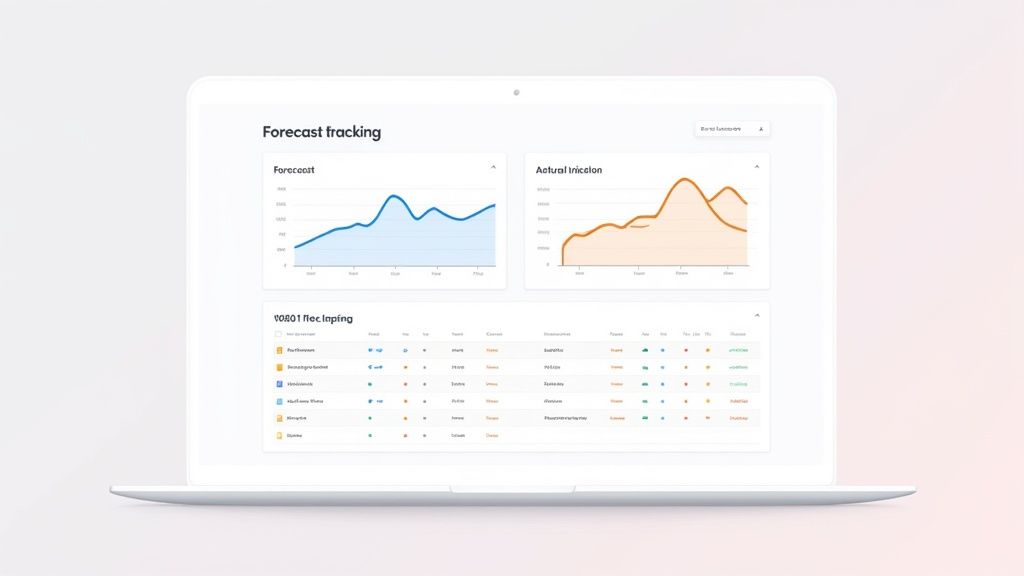
This kind of visual approach makes it incredibly easy to share your performance with the rest of the team and get everyone on the same page about improving this crucial part of the business.
Even the sharpest forecasting model is useless if it's built on a shaky foundation. So many D2C brands see their demand forecast accuracy suffer not because of a bad algorithm, but because of foundational mistakes that poison the data before the model ever sees it.
These quiet errors create a vicious "garbage in, garbage out" cycle that's frustratingly hard to diagnose. The result? A forecast that consistently misses the mark, leading to stockouts on your bestsellers and cash-draining overstock on everything else. Let's pull back the curtain on the most common offenders that are secretly wrecking your predictions.
The single most common mistake is blindly trusting your historical sales data. Raw sales figures from Shopify or any other platform don't tell the whole story. If a product went out of stock for a week, your sales data for that period shows a big, fat zero. A naive model looks at that and thinks, "Ah, zero demand." It doesn't know you had a supply failure.
When this "dirty" data gets fed into your model, it learns the wrong lessons. It will then forecast lower demand for that period in the future, basically baking the stockout into your plan and creating a self-fulfilling prophecy of lost sales.
True demand is not what you sold; it's what you could have sold if you had unlimited stock. Failing to clean your data to account for stockout periods is one of the fastest ways to undermine your demand forecast accuracy.
To fix this, you have to impute sales data for those stockout periods. This just means you estimate what you likely would have sold, maybe by looking at the sales pace right before and after the stockout. This simple step gives your model a much cleaner, more honest picture of actual customer demand.
Another massive error is failing to separate out the impact of big events like marketing campaigns, flash sales, or a shoutout from an influencer. A huge sales spike isn't just regular demand; it's promoted demand, and the distinction is critical.
If you don't tag and adjust for these events, your model will assume that massive spike is just a normal Tuesday. It will then bake that artificial lift into your baseline forecast, leading to some serious over-forecasting and a warehouse full of inventory once the promotion is over.
Here’s how it plays out:
The solution is to create event flags in your data. By tagging sales that happened during a specific promotion, you can tell your model to either ignore that data for baseline calculations or use a more advanced model that understands how to treat these external variables. This keeps your core demand forecast clean and reliable.
Trying to improve your demand forecast accuracy can feel like a massive, overwhelming project. But it doesn't have to be. Instead of trying to boil the ocean, the smart move is to follow a prioritized, step-by-step plan. This way, you put your energy where it will deliver the biggest and fastest returns.
This action plan is your roadmap, starting with the foundational fixes and moving up to more advanced strategies that build a truly resilient forecasting process.
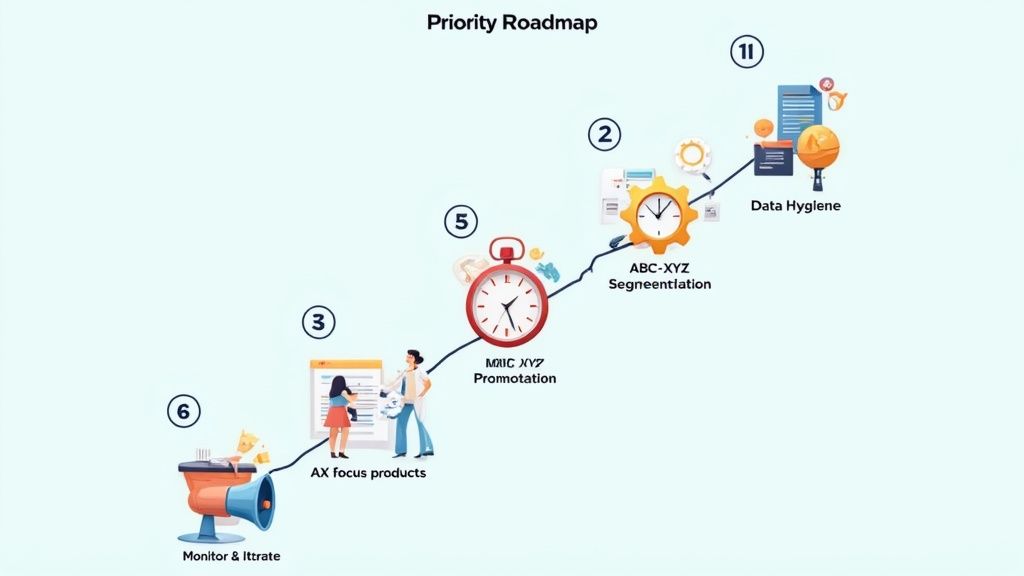
This playbook is designed to give you real, tangible results at every stage. It’ll help you turn forecasting from a reactive chore into a strategic advantage that directly boosts your bottom line.
Before you even think about touching a forecasting model, you have to clean your data. Period.
Feeding your system "dirty" historical data—information full of stockout periods or unflagged promotions—is the #1 reason forecasts go wrong. A model trained on flawed history will just learn the wrong lessons, baking your past supply chain failures into its future predictions.
Your first job is to scrub your sales history. Go back and identify every single period a SKU was out of stock and adjust the sales data to reflect what demand likely would have been. This process, sometimes called imputation, gives your model a true picture of customer intent, not just a record of your inventory problems.
A one-size-fits-all forecasting model is a recipe for inefficiency. Your high-volume, predictable bestsellers behave completely differently than your volatile, low-volume accessories. Applying the same complex algorithm to both is just a waste of time and resources.
This is where ABC-XYZ analysis becomes a total game-changer. It’s a powerful way to categorize products on two dimensions:
When you combine these, you create a strategic grid. For your high-value, predictable 'AX' products, you should absolutely invest in more sophisticated forecasting models. But for your unpredictable, low-value 'CZ' items? A much simpler method is often more effective and efficient. This ensures you’re focusing your analytical firepower where it counts.
Big marketing campaigns, flash sales, and seasonal spikes are not normal demand. If you don't separate these events, your forecasting model will mistake a one-off promotional bump for a permanent lift in baseline sales. This leads directly to over-forecasting and a warehouse full of costly excess inventory once the event is over.
You need a system to tag and separate these event-driven sales from your core, organic demand. Start building a library of past promotional uplifts. For example, maybe you know that your Black Friday sale typically generates a 250% lift for a specific category. This allows you to forecast your baseline demand cleanly and then layer a separate, event-specific forecast on top.
By treating promotions as distinct variables rather than just noise, you prevent them from polluting your baseline forecast. This dual approach dramatically improves the accuracy of both your everyday and your peak-season inventory planning.
Forecasting sales for next week is completely useless if your supplier lead time is six weeks. It's a common but critical mistake: a mismatch between the forecast horizon (how far out you predict) and the procurement lead time (how long it takes to get more stock). This misalignment guarantees you'll be making inventory decisions with outdated or irrelevant information.
Sit down with your operations team and map out the full lead time for your key products. This means from the moment you place a purchase order to the moment the goods are checked in and ready to sell in your warehouse. Your forecasting process must generate predictions that cover this entire window, ensuring your inventory decisions are always forward-looking and tied to supply chain realities.
Finally, improving demand forecast accuracy isn't a one-and-done project. It's an ongoing process of refinement. The tracking dashboard you built earlier is your command center for this continuous improvement loop.
Set a regular cadence—whether it’s weekly or monthly—to review your key accuracy metrics like wMAPE and Bias. When you spot a deviation, dig in and ask why. Was there an unexpected shout-out from an influencer? Did a competitor run a massive stock-clearing sale? Every error is a learning opportunity.
This iterative cycle of forecasting, measuring, and refining is the true engine of progress. For a deeper dive into making this a core part of your operations, explore some of the powerful inventory optimization techniques that build on this accurate foundation.
To help you get started, here is a simple table summarizing the key steps in this action plan.
| Priority Step | Objective | Key Action | Success Metric |
|---|---|---|---|
| 1. Data Hygiene | Create a clean, reliable historical sales record for your model. | Identify and adjust sales data for all historical stockout periods. | Reduction in forecast error for previously out-of-stock items. |
| 2. Segmentation | Focus forecasting efforts where they have the most impact. | Classify all products using an ABC-XYZ analysis grid. | Improved wMAPE for high-value 'A' and 'AX' items. |
| 3. Promotions | Prevent one-off events from distorting your baseline forecast. | Tag all promotional sales and build a library of uplift factors. | Lower forecast bias immediately following major sales events. |
| 4. Lead Times | Ensure your forecast is relevant for purchasing decisions. | Align your forecast horizon to match your end-to-end lead time. | Reduction in stockouts caused by ordering too late. |
| 5. Monitoring | Turn forecasting into a continuous improvement process. | Schedule regular reviews of your accuracy dashboard to analyze errors. | Consistent, quarter-over-quarter improvement in overall wMAPE. |
Following this prioritized approach will help you tackle the most impactful issues first, building momentum as you create a more accurate and reliable demand forecast for your store.
Here's the rewritten section, designed to sound like an experienced human expert and match the provided examples.
As you start weaving these strategies into your operations, you're bound to have some questions pop up. That’s perfectly normal. Getting straight answers to these common hurdles is the key to building an inventory process you can actually rely on.
There's no single magic number, but a solid rule of thumb is to aim for at least two years of clean historical sales data. This is usually enough time to see a full year's seasonality play out twice, which helps separate a real trend from a random fluke.
But don't let that stop you if you're a new store. You can absolutely start forecasting with just three to six months of data. Just be realistic—your model will be guessing when it comes to long-term seasonal swings until it has more history to learn from.
Getting this right is absolutely critical for inventory planning. A sales forecast predicts what you will actually sell, factoring in your current stock levels and marketing plans. It's a forecast that's limited by what you have on your shelves.
A demand forecast, on the other hand, is about predicting what you could have sold if you had an infinite amount of inventory. It’s the true, unconstrained voice of your customer. For smart inventory replenishment, you have to focus on the demand forecast. Otherwise, you're just baking your past stockouts into your future orders, creating a cycle of lost sales.
Think of it this way: a sales forecast tells you what you’ll likely achieve with the tools you have. A demand forecast tells you what the market opportunity truly is.
The right rhythm really depends on your business and how volatile your products are. For most D2C brands, a monthly review and update cycle hits the sweet spot. It’s frequent enough to stay responsive without turning into a full-time job.
That said, if you're dealing with fast-moving, trend-driven items, you might need to tighten that up to a weekly review. This lets you react quickly before a trend fades or a competitor eats your lunch. The most important thing is to create a consistent process so you can regularly check your accuracy, learn from what you got wrong, and make your next prediction even better.
Ready to stop guessing and start making data-driven inventory decisions? Tociny.ai uses AI to provide clear visibility and actionable recommendations, helping you reduce overstock and eliminate stockouts. Request early access to Tociny.ai and build a more profitable inventory strategy.
Tociny is in private beta — we’re onboarding a few select stores right now.
Book a short call to get early access and exclusive insights.