Ever wonder how long your current inventory would last if you stopped ordering new stock today? The days inventory on hand formula gives you that exact number. It’s a simple but powerful metric that tells you, in days, how quickly you're converting products on your shelves into cash in the bank.
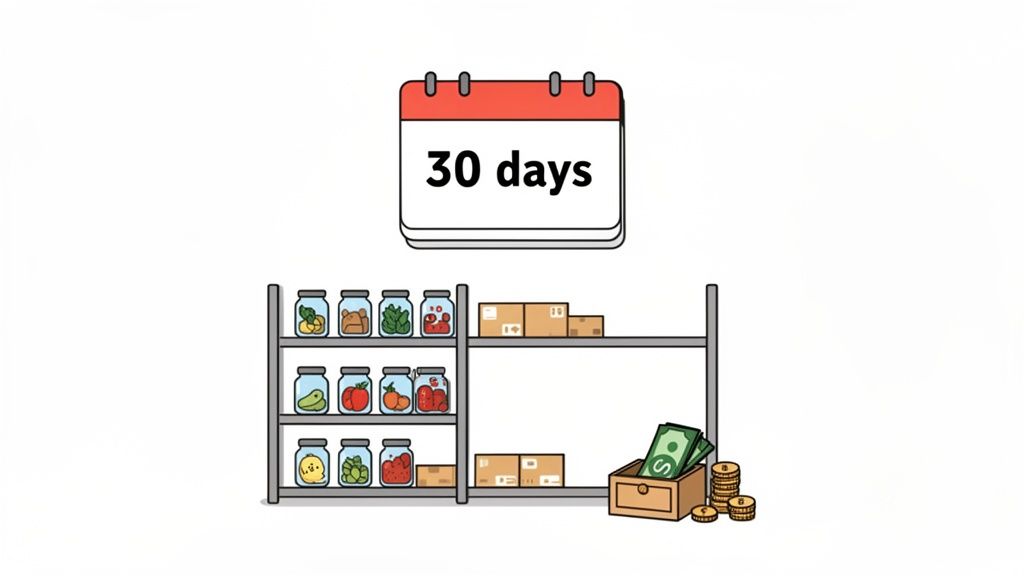
Think of your warehouse as a kitchen pantry. Your Days Inventory on Hand (DIO)—sometimes called Days Inventory Outstanding—tells you how many days' worth of meals you have before the shelves are bare. For any e-commerce brand, this figure is a critical health indicator.
At its core, DIO measures the number of days your company's cash is tied up in physical products. It’s a direct reflection of your inventory liquidity and how efficiently your operations are running.
Getting a handle on your DIO is the first step toward building a more resilient and profitable business. This isn't just an abstract number; it has immediate, real-world consequences for your store’s financial health.
A high DIO is a major red flag. It’s telling you that:
But be careful—an extremely low DIO can be just as damaging. It often means you're understocked, leading to frustrating stockouts that send potential customers straight to your competitors. The goal is to find that sweet spot.
Mastering the days inventory on hand formula elevates you from simply holding stock to strategically managing a core business asset. It transforms inventory from a cost center into a powerful tool for optimizing your cash flow.
Ultimately, tracking this metric helps you answer make-or-break questions about your operations. Are you buying the right amount of product? Are your sales forecasts on point? How quickly can you react to a sudden shift in customer demand?
For a broader view of how inventory fits into your overall financial picture, exploring other finance-related articles can connect the dots. This knowledge empowers you to make smarter purchasing decisions, cut down on waste, and free up the capital you need to scale your brand.
Alright, let's roll up our sleeves and move from theory to practice. Calculating your Days Inventory on Hand is actually pretty straightforward once you know the pieces. The most common days inventory on hand formula gives you a clean snapshot of how efficiently you're moving stock over a certain period, usually a year.
Here's the standard formula:
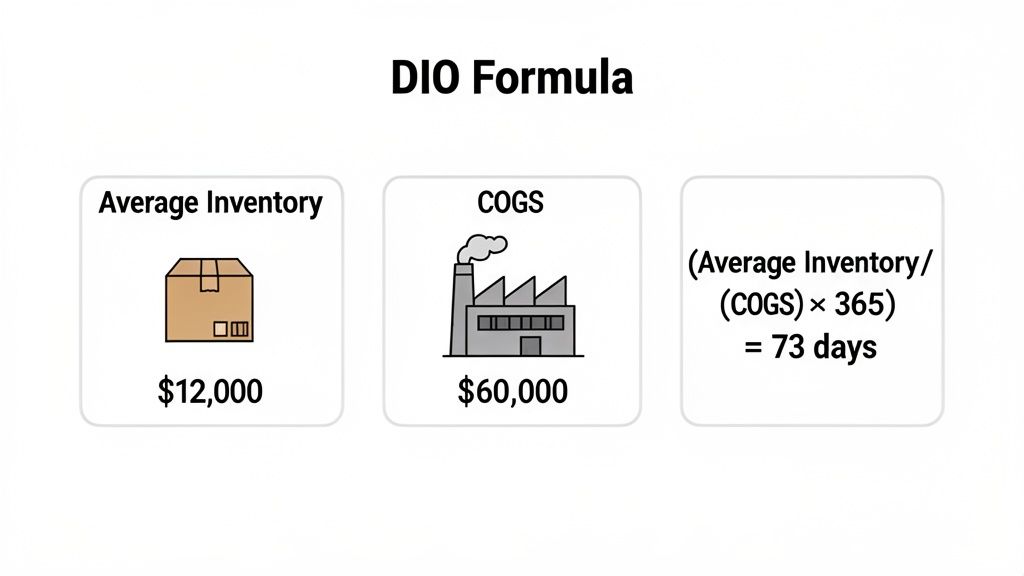
DIO = (Average Inventory / Cost of Goods Sold) * 365
In simple terms, this tells you the average number of days it takes for you to sell through your entire stock. Let's break down each part of that equation.
Your inventory levels are always in flux. New shipments arrive, and products fly off the shelves every day. To get a reliable number, you need to find the average value of your inventory over the time you're measuring.
The calculation for this is simple:
Your Beginning Inventory is just the total value of your stock at the start of the period (say, January 1st). The Ending Inventory is the value when the period closes (like December 31st). You can pull these numbers straight from your balance sheet or your inventory management system.
Next up is your Cost of Goods Sold (COGS) for that same period. This number represents all the direct costs tied to producing or buying the products you sold.
For a D2C brand, COGS usually includes things like:
What's crucial here is what COGS doesn't include. Forget about indirect expenses like marketing spend, office salaries, or the cost of shipping orders out to customers. Your accounting software will have this number waiting for you on your financial statements.
If you're still tracking this manually, a well-organized spreadsheet is key. We've got a guide on building an effective inventory spreadsheet that can help you get this sorted.
Let's put the DIO formula to work. Imagine a Shopify fashion store, "Urban Threads," wants to calculate its DIO for the past year.
Calculate Average Inventory:
Identify Annual COGS:
Apply the DIO Formula:
The result? On average, it takes Urban Threads just over two months to completely sell its inventory. This one number is a vital baseline. It gives them a starting point for judging their performance and making much smarter buying decisions moving forward.
While the average inventory method gives you a direct snapshot, there's another powerful way to calculate your days inventory on hand. This alternative approach flips the script entirely. Instead of starting with inventory levels, it begins with your sales velocity.
This method ties directly into a metric you've probably heard of: the Inventory Turnover Ratio.
Think of your inventory turnover as a measure of speed. It tells you how many times your store sells and replaces its entire stock over a specific period, usually a year. A high turnover number is a great sign—it means products are flying off the shelves. A low number? That suggests sales are sluggish.
To use this method, you first need to calculate your inventory turnover. We cover this metric in detail in our complete guide on the inventory turnover rate calculation, but the core formula is straightforward:
Inventory Turnover Ratio = Cost of Goods Sold / Average Inventory
Once you have this number, the alternative formula for DIO is incredibly simple and insightful. It translates your sales speed directly into a time-based metric.
DIO = 365 / Inventory Turnover Ratio
This version neatly shows the inverse relationship between how fast you sell and how long your inventory sticks around. The faster you turn over your stock, the fewer days it sits on your shelves tying up cash.
Let's see this in action. Imagine you run a Shopify store selling health supplements, and you want to gauge how efficiently you're managing those bottles of vitamins and protein powders.
First, you calculate the inventory turnover ratio for the past year:
This means your store sold through its entire inventory five times last year. Not bad.
Now, you can plug that turnover rate into the alternative DIO formula to see how many days your inventory hangs around.
There it is. On average, a product sits in your warehouse for 73 days before a customer buys it. This perspective is invaluable because it directly links how quickly you sell to how long your cash is tied up in stock. As you work to boost that turnover rate, you'll see a direct, measurable drop in your DIO—bringing you that much closer to a lean, cash-flow-positive operation.
If you're looking for more tips on using this formula for your Shopify store, it's a great place to start.
So you’ve calculated your Days Inventory on Hand and now you have a number. Is it good? Is it bad? The honest answer is, it depends entirely on your industry.
Chasing some universal "perfect" DIO is a rookie mistake. A jeweler selling high-end, custom watches will naturally have a much, much higher DIO than a grocer trying to move fresh avocados before they turn. Context is everything. The key is to understand what’s normal for your specific niche and use that as your starting point for a real analysis.
Think of it this way: your DIO is directly tied to how quickly you can turn over your inventory. The faster it turns, the fewer days it sits on your shelves.
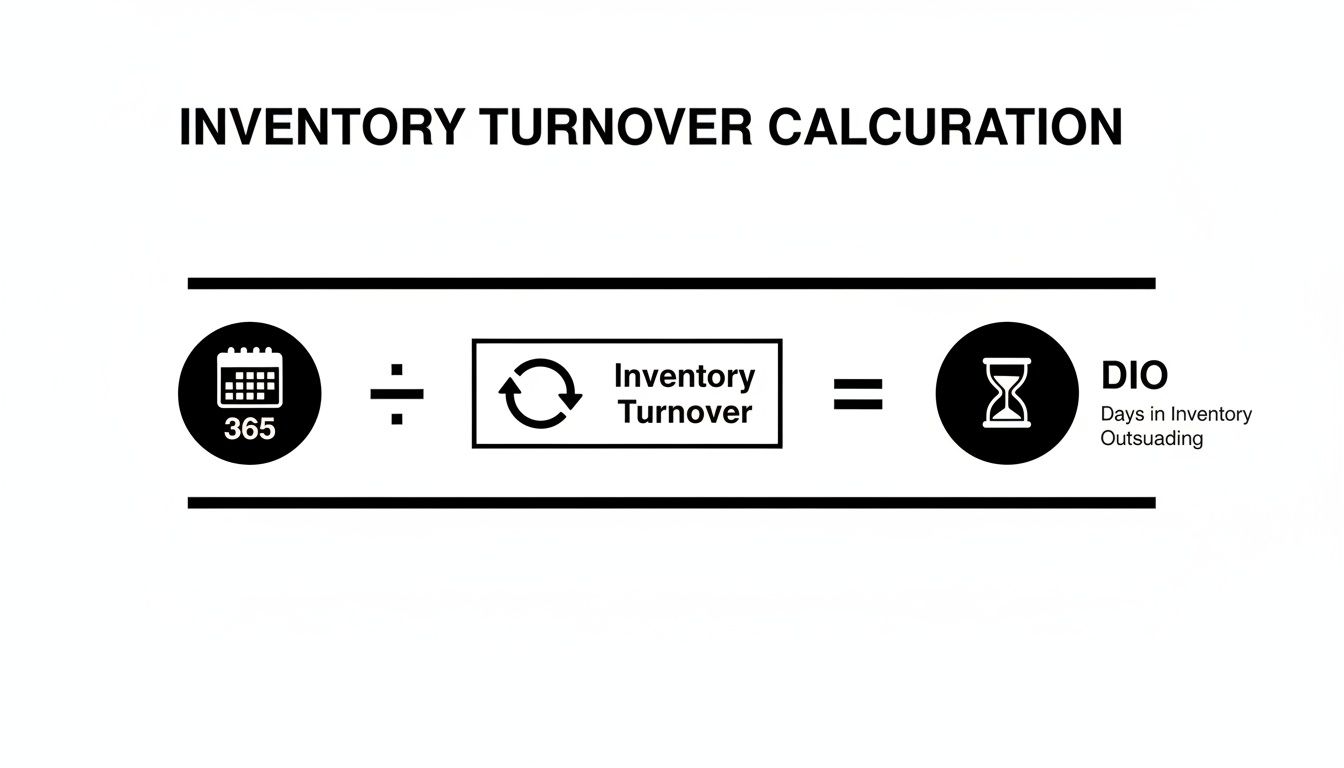
As the diagram shows, dividing 365 days by your inventory turnover ratio gives you your DIO. It’s a simple but powerful link between your sales velocity and the time your stock spends sitting in the warehouse.
To get a real sense of where your business stands, you need to compare your DIO against industry benchmarks. A number that looks alarmingly high in one sector might be perfectly healthy in another.
Use this table to see how your store stacks up against typical ranges for different D2C product categories.
| Industry | Typical DIO Range | Key Considerations |
|---|---|---|
| Fashion & Apparel | 90 - 120 Days | This is a highly seasonal game. Brands have to stock up ahead of new trends and seasons, which naturally inflates DIO. |
| Consumer Electronics | 60 - 90 Days | Tech moves fast. Products have a short lifecycle, so a lower DIO is crucial to avoid getting stuck with obsolete models. |
| Home Goods & Furniture | 100 - 150+ Days | Bigger, more expensive items just don't sell as quickly. This longer sales cycle means a higher DIO is the norm. |
| Health & Wellness | 45 - 75 Days | Expiration dates are the big driver here. Supplements and skincare need to move, making efficient turnover essential to prevent waste. |
| Food & Beverage | 15 - 45 Days | Perishability is everything. For obvious reasons, a very low DIO is needed to guarantee freshness and keep spoilage to a minimum. |
Seeing these ranges makes it clear that your DIO is more than just a metric—it's a snapshot of a critical business trade-off.
A high DIO means your cash is trapped in products that aren't selling. This ties up capital, drives up storage costs, and increases the risk of your inventory becoming obsolete or damaged. On the flip side, a DIO that's too low is a major red flag for stockouts, which can lead to lost sales and frustrated customers who might not come back.
The real goal isn't just to hammer your DIO down to the lowest possible number. It’s about finding the sweet spot.
You need just enough inventory on hand to meet customer demand without a hitch, but not so much that it bleeds your cash flow dry and puts the business at risk. By analyzing your DIO within the context of your industry, you can turn this simple calculation into a powerful guide for smarter, more sustainable growth.
Knowing your Days Inventory on Hand (DIO) is the first step. The real magic happens when you turn that insight into action. A high DIO isn't just a number on a spreadsheet—it's a clear signal that your cash is trapped on shelves instead of fueling your growth.
The goal is simple: lower that number without ever risking a stockout. It’s a delicate balancing act, one that requires a smart, multi-faceted approach to inventory management. You need just enough product to keep customers happy, but not so much that it becomes a financial dead weight.
Let’s be honest, guesswork is a terrible inventory strategy. Accurate forecasting is the absolute bedrock of a healthy DIO. It’s about anticipating what your customers will buy and when, moving beyond just last month’s sales data to really understand the bigger picture.
This is where modern tools completely change the game. AI-powered analytics platforms like Tociny.ai can sift through historical sales, pinpoint emerging trends, and factor in seasonality to predict future demand with stunning accuracy. This data-driven approach means you can order new stock with confidence, sidestepping the overbuying that inflates your DIO.
For a deeper dive into improving your stock efficiency, check out these strategies for mastering stock control.
Every store has them: the "shelf-warmers." These are the products that just don't move, and they're a primary driver of a high DIO. They silently drain your cash through storage fees and tied-up capital. Finding and liquidating this dead stock is non-negotiable.
Here are a few proven ways to clear out those slow movers: * Targeted Promotions: Run a flash sale or create an exclusive discount code for a specific slow-moving item. A little urgency goes a long way. * Product Bundling: Pair a less popular item with one of your bestsellers. This boosts the perceived value and helps move product that would otherwise just sit there. * Clearance Sections: Set up a dedicated "Last Chance" or clearance page on your Shopify store. You'll attract bargain hunters and clear the shelves.
The stakes are especially high in certain industries. For food and beverage brands, holding inventory for more than 60 days can lead to 10-15% waste from spoilage. At the same time, stockouts can vaporize 8-12% of revenue—a painful reality for 29% of small e-commerce stores every single quarter.
Your reorder point is the magic number that tells you when to place a new purchase order. If you set it too high, you'll end up overstocked with a bloated DIO. Set it too low, and you're staring down the barrel of stockouts and angry customers. A smart reorder point perfectly balances your supplier's lead time with your daily sales velocity.
By optimizing your reorder points, you can put a huge chunk of your inventory management on autopilot. This helps you maintain a lean inventory while still having enough safety stock to handle those unexpected demand spikes, which directly improves both your DIO and your cash flow.
Ultimately, optimizing your inventory isn't a one-and-done task; it's an ongoing cycle of analysis and adjustment. By focusing on these core strategies, you can transform your inventory from a liability into a dynamic asset that actively supports your brand's growth. To learn more, check out our guide on other powerful inventory optimization techniques.
Even with a solid grasp of the days inventory on hand formula, some practical questions always surface when you start crunching the numbers for your own business. Getting the details right is what turns this metric from a simple calculation into a powerful guide for your inventory strategy.
Let's clear up the common hurdles and questions that trip up most D2C brands. Nailing these specifics is key to making sure your DIO calculations lead to smarter, more profitable decisions.
For most e-commerce stores, running your DIO numbers on a monthly basis is the sweet spot. It gives you timely data to act on without bogging you down in administrative work. This frequency lets you catch developing trends—like a product that’s starting to move sluggishly—before they balloon into serious cash flow issues.
But this isn't a hard-and-fast rule. The right rhythm really depends on your business.
The most important thing? Consistency. Whether you land on weekly, monthly, or quarterly, sticking to a regular schedule is what lets you build a reliable historical baseline and spot patterns that actually mean something.
You bet it can. While a low DIO often gets praise as a sign of peak efficiency, a number that's too low is a major red flag. It’s the classic sign that you’re running too lean and are at a huge risk of constant stockouts—which can be far more damaging than holding a bit of extra inventory.
A dangerously low DIO means you're almost certainly leaving money on the table. Every stockout is a lost sale, and worse, a frustrated customer who might just head over to a competitor and never look back.
Beyond just lost sales, an extremely low DIO can actually drive up your operating costs. You'll end up placing smaller, more frequent purchase orders with your suppliers, which often means paying more in shipping and missing out on valuable volume discounts. The goal isn't just to get the number down; it's to find that lean, optimized level that includes just enough safety stock to keep your customers happy and your sales flowing without a hitch.
The short answer is no. The standard days inventory on hand formula wasn't built for a pure dropshipping model. The reason is simple: a key piece of the formula is your Average Inventory, and for a dropshipper, that number is effectively zero. You don't buy or hold the stock, so you can't measure how long it's sitting on your "shelves."
Instead of DIO, dropshippers should be laser-focused on a different set of metrics to track their operational health:
Now, if you're running a hybrid model—holding some inventory yourself while dropshipping other products—you should absolutely calculate DIO, but only for the stock you physically own and manage.
Ready to move from spreadsheets to smart predictions? Tociny.ai uses AI to analyze your sales data, forecast future demand, and provide actionable recommendations to optimize your inventory levels. Stop guessing and start making data-driven decisions that boost your cash flow and prevent stockouts. Get early access to Tociny.ai and transform your inventory planning.
Tociny is in private beta — we’re onboarding a few select stores right now.
Book a short call to get early access and exclusive insights.