Inventory turnover rate shows how often your stock swaps hands in a set period. It’s simply Cost of Goods Sold divided by average inventory. That ratio speaks volumes about cash flow and inventory health.
In this walkthrough, I’ll explain why turnover matters for e-commerce stores. You’ll gather COGS figures, pull inventory snapshots, crunch the numbers, and see how you stack up against peers.
Before diving in, make sure your Cost of Goods Sold includes only direct product costs—leave out overhead and fees. And pick the right method for average inventory, whether it’s a simple midpoint or a weighted approach for seasonal highs.
Below is a quick look at each piece of the calculation and how it fits into the bigger picture.
| Component | Definition | Purpose |
|---|---|---|
| Cost of Goods Sold | Total cost for items sold | Tracks expense linked to sales |
| Beginning Inventory | Stock value at period start | Establishes the opening balance |
| Ending Inventory | Stock value at period end | Captures the closing balance |
| Average Inventory | (Beginning + Ending) ÷ 2 | Softens short-term swings |
This table should clear up why each component matters—and how they combine to deliver your turnover figure.
When you put it all together, the formula tells a story. Suppose annual COGS is $500,000 and average inventory rounds to $100,000. That gives you a 5 turns per year ratio—about 73 days of stock on hand (365 ÷ 5).
“A higher turnover rate means you’re recovering cash faster and cutting down holding costs,” notes veteran merchant Ana Chen.
Next, decide on your reporting cadence. A monthly view highlights recent shifts but can wobble with seasonality. Quarterly or yearly lenses smooth out the noise but mask short-term spikes.
By now, you’ve got the fundamentals to calculate turnover by hand and see exactly where Tociny.ai can take that process off your plate and visualize results.
With the basics in place, it’s time to set targets tailored to your market. Aim for 8–12 turns annually in fashion, 6–10 for electronics, and 4–8 in home goods.
In the following section, we’ll explore how Tociny.ai automates these steps. It plugs into Shopify, cleans up your COGS data, and lays out turnover trends in dashboards—so you can focus on growth, not manual spreadsheets.
Inventory turnover shows how often you sell and restock your merchandise over a set period. It’s a window into your cash flow and reveals whether you’ve got slow-moving piles or agile inventory.
Nailing the formula and feeding it clean numbers is non-negotiable. A small slip in data can mask overstock issues or leave you blind to critical trends.
Inventory turnover ratio = Cost of Goods Sold ÷ Average Inventory And Average Inventory = (Beginning Inventory + Ending Inventory) ÷ 2
This straightforward calculation packs a punch: it tells you how many times stock moves in a year. By comparing COGS to what you hold, you connect sales performance directly to holding costs.
Consider a Shopify boutique that logs ₹41,50,000 in COGS against ₹4,98,000 in average inventory. The result is 8.33 turns per year—about a new stock cycle every 44 days.
Before you dive into dashboards, make sure you:
Here’s how different retail formats compare:
Key Inventory Turnover Metrics Comparison
| Metric | Formula | Typical Range | Rotation Days |
|---|---|---|---|
| Retail Physical Store | COGS ÷ Avg Inventory | 4–6 turns | 61–91 days |
| E-Commerce Business | COGS ÷ Avg Inventory | 6–12 turns | 31–61 days |
| Omnichannel Retailer | COGS ÷ Avg Inventory | 6–10 turns | 36–61 days |
Use these benchmarks to see where you stand—and where you can push for better performance.
Picture an activewear brand on Shopify. Over 12 months, COGS hits ₹41,50,000 while average stock sits at ₹4,98,000.
Divide one by the other and you get 8.33 turns annually—so you reorder roughly every 44 days. Tracking this month to month reveals seasonal dips or unexpected surges.
Dropping under 5 turns? You might be overstocked. Hitting above 12? You risk stockouts.
A balanced turnover is key for cash flow and customer satisfaction
Even small errors can distort your turnover ratio. Look out for:
Routine audits help, but automation is even better. A tool like Tociny.ai syncs inventory and COGS cleanly, cutting human error.
A low turnover often means cash is tied up in slow movers. A high rate may signal frequent stockouts.
Compare your numbers to sector norms and tweak your reorder points. Watch trends over time—dashboards and alert thresholds keep you proactive.
Dig into SKU-level data to spot your fastest and slowest movers:
“Clean Data Beats Complex Models,” explains an operations lead at a major brand.
Turnover benchmarks vary widely:
Don’t chase a one-size-fits-all number. Set targets by category to align goals with reality.
Start calculating today and turn raw data into sharper cash-flow decisions.
Explore hands-on dashboards and automated alerts with Tociny.ai.
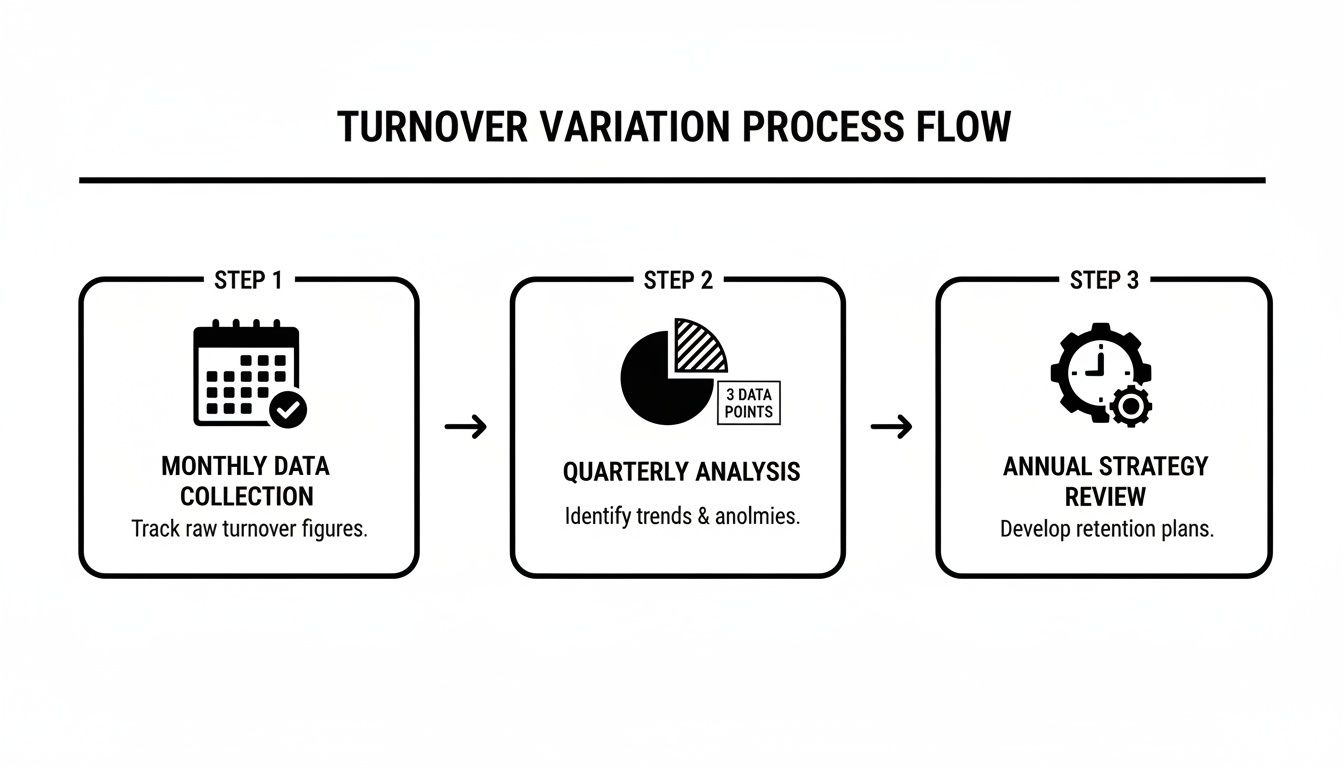
Every store dances to its own sales beat. Tracking your inventory turnover rate with the right rhythm shines a light on how quickly merchandise moves.
In the sections that follow, you’ll find ways to calculate turnover on monthly, quarterly, or annual cycles. Choose the one that feels most in tune with your operation.
Monthly turnover divides that month’s Cost of Goods Sold (COGS) by average inventory during the same period. Quarterly repeats this math over a three-month span. Annual turnover leans on a full year of totals.
| Period | Formula | Ideal For |
|---|---|---|
| Monthly | COGSₘₒₙₜₕ ÷ AvgInvₘₒₙₜₕ | Flash sale or pop-up shops |
| Quarterly | COGSᵩᵤₐᵣₜₑᵣ ÷ AvgInvᵩᵤₐᵣₜₑᵣ | Seasonal collections |
| Annual | COGSᵧₑₐᵣ ÷ AvgInvᵧₑₐᵣ | Long-term trend analysis |
When holiday sales or product launches skew your numbers, weighted averages can bring balance. You multiply each period’s inventory by its share of total sales, then divide by the sum of those weights.
A winter apparel retailer reduced overstocks by 18% after applying weighted averages over a six-month cycle.
It’s common to find donated samples or promotional giveaways lumped into COGS. Cleaning out those one-off expenses ensures your inventory turnover rate zeroes in on actual merchandise flow.
Different business models also tweak the formula:
Subscription Example • Calculate quarterly COGS including buffer additions • Average starting and ending inventory for each quarter • Apply weighted averages to smooth signup spikes
Drop Shipper Example • Use Sales ÷ Avg Inventory for lean operations • Exclude shipping pass-through costs from COGS
Running multiple methods side by side reveals which one signals reorder points most accurately. Start with the shorter window, then layer in the longer one to spot consistent trends.
Mixing methods is okay if you segment by product type or season.
Tools like Tociny.ai make it easy to swap formulas without rebuilding spreadsheets. You get automated COGS cleanup, period selection, and live charts in seconds.
Once your favorite formula is nailed down, lock it in and watch performance against industry benchmarks. That’s how you keep your e-commerce inventory agile, cash-friendly, and poised for growth.
Raw turnover numbers need context. Layering in industry norms helps you decide which variation tells the clearest story.
With Tociny.ai, you can overlay these benchmarks directly onto your turnover lines and spot the best fit in real time.
Getting your raw data straight from Shopify is the most reliable way to nail your turnover figures. First, export your COGS and inventory snapshots as CSV files for the exact period you want to review. You’ll need one CSV for total Cost of Goods Sold and another for inventory values at the start and end dates.
With those exports in hand, calculating Average Inventory in Excel or Google Sheets becomes a breeze. A clean dataset also means fewer headaches when it’s time to spot trends or anomalies.
Once you’re logged into Shopify, head over to Analytics → Reports and select either the Profit or Transactions report to pull your COGS details.
That view shows SKU-level stock values alongside the total inventory cost. Export it as a CSV, then open it up in your spreadsheet tool of choice.
Key Data Prep Tips:
Give your new sheet clear headers: Date, COGS, Beginning Inventory, Ending Inventory, and Average Inventory. From there, let formulas do the heavy lifting.
• Calculate Average Inventory with =AVERAGE(D2, E2)
• Derive Inventory Turnover Rate using =B2 / F2
• Use INDEX-MATCH (more stable than VLOOKUP) to tie SKUs to costs
Pro Tips:
Numbers in a grid only go so far. A simple line chart—Date on the X axis, Turnover Rate on the Y axis—makes seasonality and spikes impossible to miss.
When you chart monthly versus quarterly and annual rates, you’ll see how shorter windows can look noisy and how yearly views smooth out the ups and downs. For a ready-made template and interactive examples, check out our guide on the inventory turnover ratio calculator.
Manually updating CSVs and formulas can eat up hours every week. Tociny.ai links directly to Shopify, pulls in your COGS, and snapshots inventory values in real time. You end up with:
Most data hiccups boil down to mismatched SKUs or missing cost fields. A quick audit of your Shopify product tags and cost settings usually fixes the trick.
Regularly reconciling your template with live Shopify data can prevent drift.
Watch out for:
| Period | Formula | Use Case |
|---|---|---|
| Monthly | COGS ÷ AvgInvₘₒₙₜₕ | Flash sales monitoring |
| Quarterly | COGS ÷ AvgInvᵩᵤₐᵣₜₑᵣ | Seasonal collections |
| Annual | COGS ÷ AvgInvᵧₑₐᵣ | Long-term trends |
Schedule a weekly check-in on your dashboard and tweak your alert thresholds as your sales patterns evolve. Grant view-only access to colleagues to keep the master sheet intact. Over time, you’ll uncover which SKUs deserve higher reorder points and which ones are tying up cash.
Automated tools like Tociny.ai free up your calendar for high-impact strategy instead of spreadsheet maintenance. With your live Excel or Sheets dashboard plugged into Shopify, turnover tracking becomes effortless.
Set email or Slack pings for sudden swings in turnover or unexpected inventory jumps. For example:
These simple notifications help you stay proactive—no more scrambling to prevent stockouts or firefighting rush orders.

Raw turnover numbers only tell half the story. They hint at stock health but don’t explain cash flow efficiency or inventory risks.
Benchmarks in key categories—fashion, electronics, beauty, and home goods—give you context for setting achievable goals.
A sky-high turnover usually means strong demand, but push it too far and you risk stockouts. On the flip side, a low rate ties up working capital in slow-moving items.
Knowing that apparel aims for 8–12 turns annually while home goods sit closer to 4–8 turns gives you a clear directional target.
Every sector has its own rhythm:
These figures act like a compass—showing where you stand and where you can push harder.
Not all products move at the same speed. High-margin lines, like jewelry, often trade off speed for profit, while consumables—snacks or supplements—can exceed 12 turns easily.
Use these tailored ranges to fine-tune reorder points and avoid cash getting stuck in slow sellers.
If your turns suddenly dip over several months, you’re likely overstocked or demand is cooling off. Wild spikes, on the other hand, point to repeated stockouts and emergency orders.
Consistent turnover monitoring prevents cash leaks and surprise backorders.
Set up a real-time dashboard and trigger alerts for any major swings.
Your benchmarks aren’t set-and-forget. Supply-chain hiccups, shifting trends, or seasonal surges all call for a quarterly review.
If promotions or flash sales clutter your data, run scenario planning before finalizing new targets.
For deeper context learn more about Days Inventory Outstanding and its link to turnover.
With Tociny.ai plugged into Shopify, live sales and stock levels feed straight into interactive charts.
Imagine a beauty brand watching its rate slide from 11 turns to 8 turns in a quarter. Tociny.ai’s engine runs “what-if” orders and shows how you can nudge it back to 12 turns.
| Metric | Before | After |
|---|---|---|
| Turnover | 8 turns | 12 turns |
| Days in Stock | 45 days | 30 days |
That shift slashes holding days, boosts cash flow, and keeps sales humming.
These steps sharpen your cash flow and reorder playbook so you stay nimble no matter the market swings.
We’ll tackle common mistakes and fixes to sharpen your turnover accuracy soon.
A miskeyed figure here and a misaligned cost there can send your inventory turnover rate on a wild ride. It often starts with small data hiccups that grow into distorted cash-flow signals.
Spreadsheets silently mix weight, volume and SKU counts. That slip inflates COGS or inventory values and sends your turnover calculation off-track.
You might think FIFO and LIFO are just accounting terms. In practice, switching mid-year can make your turnover leap for all the wrong reasons.
Choosing one method and sticking with it reveals genuine trends instead of accounting noise. Consistency shines a light on real performance shifts.
“A single costing mix-up can masquerade as a 20% increase in efficiency,” warns inventory lead Maria Ortiz.
Practical Fixes For Costing Mix-Ups
Returns often vanish between COGS reports and inventory snapshots. Suddenly, your turnover looks impressively high—until inventory balances reveal the truth.
You want credit adjustments and exchanged items feeding back into each month’s snapshot. Ignoring this will hide slow-moving pieces under a veil of phantom efficiency.
| Issue | Impact | Fix |
|---|---|---|
| Untracked Returns | Overstates turnover by 15% | Automate return data in snapshots |
| Exchange Adjustments | Understates inventory on hand | Set validation rules for exchanges |
| Refunds in COGS | Inflates cost of goods sold | Exclude refunds from COGS exports |
For extra tactics on handling returns and reorders, check out our guide on identifying slow-moving inventory
Hand-typed CSV uploads are invitations to error. A daily or weekly pull from Shopify keeps SKUs and costs in lockstep.
In Google Sheets or Microsoft Excel, set rules to flag missing costs or duplicates. That alert pops up before a rogue entry skews your inventory turnover metric.
With Tociny.ai in place, your dashboard pinpoints any number that drifts outside expected ranges. No more surprise fire drills—just proactive data health checks.
Automation does most of the heavy lifting, but a quarterly deep dive keeps your numbers honest. Even small exceptions can slip through filters and build up over time.
Grab a random sample of high-value SKUs and compare what’s on the shelf to what your system shows. Reconcile any gaps within 48 hours to stop errors in their tracks.
Pairing hands-on audits with automated safeguards gives you a true sense of inventory health—and ensures your turnover insights are rock solid.
Even with a solid inventory framework, some questions always surface. Here, we tackle the quirkiest scenarios that trip up online merchants and share practical fixes you can use right away.
When Should You Recalculate Turnover?
Finding the sweet spot matters. Too infrequent and you’ll miss sudden shifts. Too often and you’ll drown in noise.
• Monthly for fast movers to catch sudden surges • Quarterly if seasonality drives your business • Annually when you’re focused on big-picture strategy
Flash sales and promo codes can make your turnover rate look fantastic—briefly. But those lower margins can hide eroding profits.
Discounts May Boost Turns But Hide Profit Erosion
Selling software licenses or online courses? You still need a turnover measure.
With those tweaks, the classic formula tracks your digital inventory just as smoothly as physical goods.
Stuck shipments can inflate your ending inventory and drag your turnover rate down. A simple date shift or buffer can reset your numbers.
That way, you’ll smooth out short-term bottlenecks and see a more accurate turnover figure.
If manual tweaks are eating up your time, let Tociny.ai handle the heavy lifting. Get real-time alerts, automated calculations, and clear visual dashboards with Tociny.ai.
Tociny is in private beta — we’re onboarding a few select stores right now.
Book a short call to get early access and exclusive insights.