To figure out your days of inventory, you just divide your average inventory value by your cost of goods sold (COGS), then multiply that number by 365. It’s a straightforward formula that tells you exactly how long it takes to turn your stock into actual sales. Honestly, getting a handle on this calculation is one of the quickest ways to truly understand your brand's cash flow and how efficiently you're running things.
Let's cut through the accounting jargon for a second. Days of Inventory (DIO)—sometimes called Days Sales of Inventory (DSI)—is much more than just a number on a spreadsheet. Think of it as a vital sign for your direct-to-consumer brand's financial health and a cornerstone of smart inventory management.
Here's a simple way to look at it: every single unsold product sitting on your shelves represents cash that isn't working for you. Your DIO tells you precisely how many days your money is tied up, frozen inside that unsold stock. It’s a direct measure of how liquid your inventory really is.
A high DIO can be a major red flag. It often points to deeper issues bubbling under the surface, such as:
On the flip side, a low DIO is usually a sign of a healthy, efficient operation. It suggests your products are flying off the shelves, your purchasing is in sync with demand, and your cash is constantly cycling back into the business to fuel more growth.
Understanding your days of inventory isn't just an academic exercise; it directly impacts your profitability. The longer your inventory sits, the more it costs you—and those expenses go way beyond what you paid for the product.
Every day an item remains unsold, it racks up costs that eat away at your margins. Our guide on what is inventory carrying cost breaks down how these expenses include everything from storage fees and insurance to labor and the risk of the product becoming damaged or obsolete.
To give you a quick summary, here’s a table that breaks down the key components.
| Component | What It Means for Your Business | Where to Find This Number |
|---|---|---|
| Average Inventory | The typical value of inventory you hold over a period. | From your balance sheet or inventory management system. |
| Cost of Goods Sold (COGS) | The direct cost of producing the goods you sold. | On your income statement. |
| Days in Period | Usually 365 for an annual calculation, or 90 for quarterly. | Based on the time frame you're analyzing. |
By getting a firm grip on this calculation, you can turn your inventory from a passive asset into an active driver of your financial health.
Mastering this calculation empowers you to make smarter purchasing decisions, optimize your marketing spend, and ultimately free up precious capital. It's a game-changer.
For D2C brands, especially those running on platforms like Shopify, consistently tracking DIO provides a real competitive edge. It helps you benchmark your performance against others in your niche. After all, a fast-fashion brand’s ideal DIO will look completely different from that of a luxury furniture store.
Knowing your number allows you to set realistic targets and spot negative trends before they snowball into critical problems. In fact, research shows that companies that manage to reduce their DIO by 20% annually can boost their return on equity by as much as 15%. This isn't just about counting stock—it’s about making every single dollar count.
Jumping into how to calculate days of inventory doesn't require an accounting degree. It all boils down to two primary formulas. Both are straightforward, get you to the same place, and give you a powerful snapshot of your inventory health. Let's walk through them so you can start applying them to your own brand.
This is the one you'll see most often—it's the industry go-to for a reason. It directly compares the value of the inventory you're holding against the cost of the products you've sold. Simple and effective.
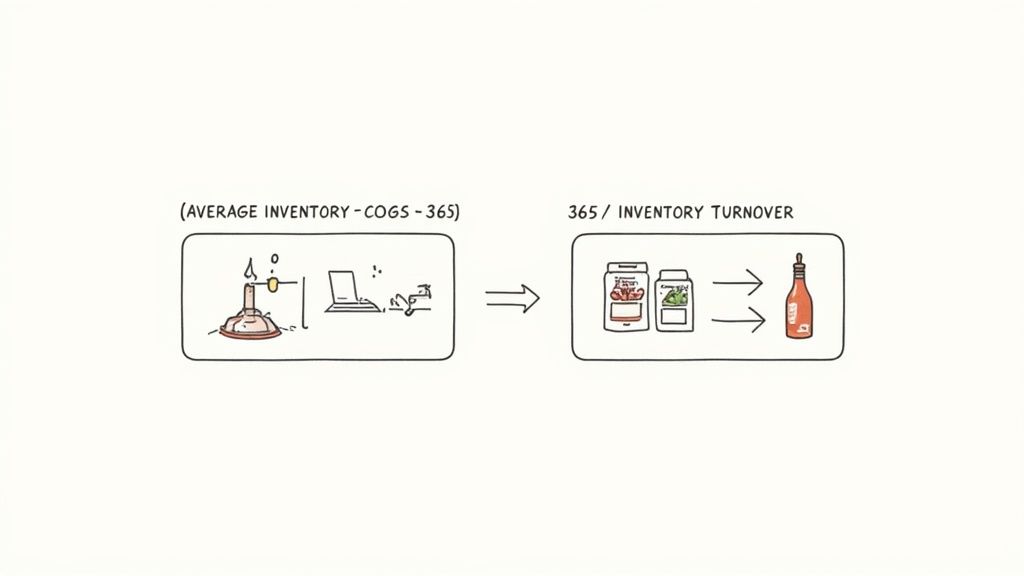
(Average Inventory / Cost of Goods Sold) x 365 = Days of Inventory
Let's quickly demystify the pieces of that equation:
Let's Use a Craft Hot Sauce Company as an Example
Imagine your D2C hot sauce brand kicked off the year with $20,000 worth of inventory and wrapped it up with $30,000. Your average inventory is $25,000.
If your COGS for that year was $150,000, the math is simple:
( $25,000 / $150,000 ) x 365 = 60.8 days
So, what does this tell you? On average, a bottle of your signature hot sauce sits on a warehouse shelf for about 61 days before it gets shipped to a customer.
Here’s another way to look at the same problem. This approach ties DIO directly to another key metric you should already be tracking: the inventory turnover ratio. This ratio tells you how many times you sell through your entire stock in a year.
The relationship is beautifully simple: a high turnover means a low DIO. The faster you sell, the less time your products gather dust. If you want to dive deeper into this, our guide on the inventory turnover ratio calculator is a great place to start.
The formula itself is as clean as it gets:
365 / Inventory Turnover Ratio = Days of Inventory
To use this, you first need your Inventory Turnover Ratio, which is calculated as: COGS / Average Inventory.
Back to the Hot Sauce Example
Let's crunch the numbers again using the same hot sauce company:
$150,000 (COGS) / $25,000 (Average Inventory) = 6Now, we just plug that number into the DIO formula:
365 / 6 = 60.8 days
Notice anything? We landed on the exact same number. Both formulas work perfectly, but the turnover method really helps you see the direct link between sales velocity and cash flow. For a broader look at the numbers that drive your business, this guide to essential inventory management formulas is another helpful resource. Knowing both methods gives you a much richer understanding of how well your inventory is performing.
Theory is great, but the real magic happens when you plug in your own numbers. It’s time to roll up your sleeves and figure out your Days of Inventory Outstanding (DIO) using the tools you already have. This is the crucial step where you move from just knowing a metric to actually using it to make smarter decisions for your brand.
We’ll walk through exactly where to find the data in Shopify, how to pop it into a simple spreadsheet, and how to run the numbers for both your entire product portfolio and a single, specific SKU.
For most D2C brands, your key numbers—inventory value and Cost of Goods Sold (COGS)—are just a few clicks away. No need to dig through dense financial statements to get started.
Here’s where to look:
With those two pieces of information, you have everything you need to calculate your brand's overall DIO. Simple as that.
Now, let's get this data organized. A basic spreadsheet is the perfect tool for creating a DIO calculator you can use again and again.
Let's say you run a D2C skincare brand. You pull your numbers for the last year and find:
First, find your Average Inventory: ($45,000 + $55,000) / 2 = $50,000
Now, plug that into the DIO formula: ($50,000 / $300,000) x 365 = 60.8 days
This means your business holds onto its inventory for about 61 days on average before selling it. That single number is a fantastic health check for your entire operation.
Another way to look at this is through the inventory turnover ratio. For our skincare brand, that would be COGS / Average Inventory, or $300,000 / $50,000 = 6. Then, DIO = 365 / 6 = 60.8 days. The inverse relationship is what's important here: higher turnover means a lower DIO, which frees up cash. You can get a more detailed look at this relationship in this in-depth analysis on Wall Street Prep.
This is where things get really interesting. Calculating DIO for a specific product is how you start spotting your winners and your slow-moving duds. Let’s take a look at your "Vitamin C Serum."
For the last quarter (90 days), you find:
First, the Average Inventory: ($5,000 + $3,000) / 2 = $4,000
Now, calculate DIO for the quarter: ($4,000 / $10,000) x 90 = 36 days
This serum is flying off the shelves, selling almost twice as fast as your company average of 61 days! It's a star performer. If another product, say a "Night Cream," had a DIO of 120 days, you'd immediately know where to focus your marketing or maybe consider a promotion to clear out stock.
This kind of granularity is what separates good inventory management from great inventory management. It directly impacts your reordering strategy. For a fast-mover like the serum, you need a different plan than for a slower product. Understanding how to calculate safety stock in inventory is the next step to ensure you meet demand for your bestsellers without risking a stockout. And calculating DIO at the SKU level gives you the exact data you need to set those safety stock levels with confidence.
So, you've run the numbers and now have your Days of Inventory Outstanding. Great. But what does that number actually mean? Calculating a metric is one thing; knowing whether it’s good, bad, or just mediocre is where the real work begins.
Let's get one thing straight: there's no magic, universal "good" DIO. A healthy number is completely relative to your industry, your business model, and the specific products you sell. Context is king.
A fast-fashion brand built on rapid trends might aim for a tight DIO of 30-45 days. On the flip side, a D2C company selling high-end, made-to-order furniture could have a perfectly healthy DIO of over 180 days. One isn't inherently better than the other. They just reflect totally different operational realities and customer expectations.
To get a sense of where you stand, it's incredibly helpful to look at typical DIO ranges for different D2C sectors. Think of it as a sanity check—a way to see if your performance is in the right ballpark or if there's a potential issue you need to dig into.
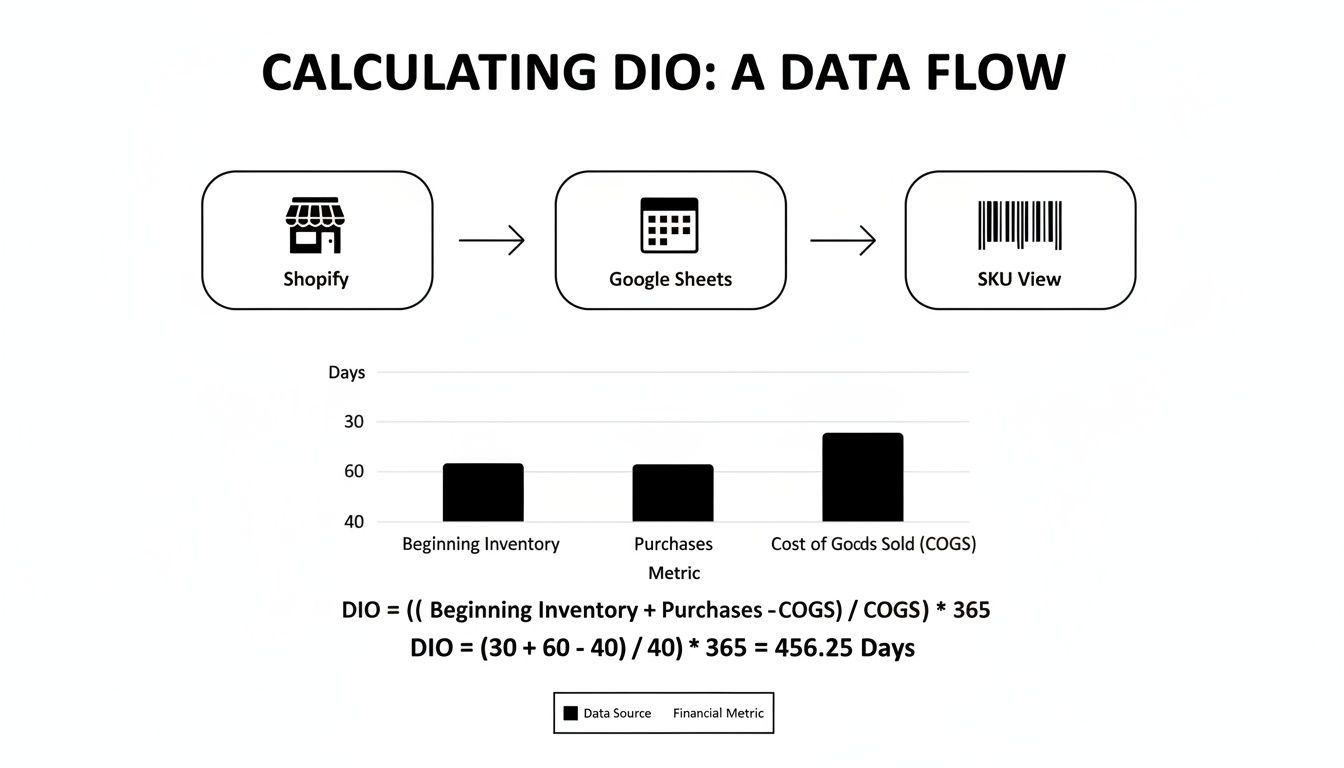
This workflow is exactly how you turn raw store data from platforms like Shopify into an actionable metric that guides inventory decisions for every single product in your catalog.
To put these numbers into perspective, take a look at how different industries operate. Each has its own rhythm based on production lead times, product shelf life, and consumer buying habits.
| Industry | Typical DIO Range (Days) | Why This Range Is Common |
|---|---|---|
| Apparel & Fast Fashion | 30 - 60 | Trends move lightning-fast. Brands need to turn over stock quickly to avoid getting stuck with last season's styles. |
| Consumer Electronics | 60 - 90 | Longer manufacturing lead times and complex supply chains often result in higher inventory levels. |
| Food & Beverage | 15 - 45 | Perishability is the name of the game. A low DIO is critical to minimize spoilage and waste. |
| Furniture & Home Decor | 90 - 180+ | High-ticket items with longer sales cycles and often made-to-order production lead to higher DIOs. |
| Beauty & Cosmetics | 75 - 120 | Wide product assortments and the need to manage expiration dates often lead to a higher DIO. |
This table should help you contextualize where your brand fits in. But remember, these are just averages. Global events can throw everything off kilter. For instance, global chip shortages once pushed the tech industry's average DIO to 75 days, a number that's slowly coming down as supply chains normalize.
The stakes are high. Holding costs can eat up 25% of your inventory's value every year, and one study found that 30% of bankruptcies are linked to inventory pileups. If you want to dive deeper into the financial mechanics, the Corporate Finance Institute has a great breakdown of DIO's role in financial analysis.
While industry benchmarks are a fantastic starting point, the most powerful insights come from tracking your own DIO over time. A single number is just a snapshot. A trend tells a story.
Get into the habit of calculating your DIO on a consistent schedule—monthly is great, but quarterly works too for most D2C brands. Plotting this data on a simple chart will reveal patterns that are completely invisible in a one-off calculation.
Tracking your DIO trend is like having an early warning system for your business. It allows you to spot both problems and opportunities long before they show up on your profit and loss statement, giving you time to act.
This consistent analysis moves you from being reactive to proactive. Instead of scrambling to clear out overstock, you can start preventing it. You can adjust purchasing for seasonal items with confidence and double down on marketing for products that are clearly picking up steam.
Ultimately, figuring out what a "good" DIO looks like for your brand is less about hitting a magic number and more about using the metric to drive smarter, continuous improvements in your business.
Knowing how to calculate your Days of Inventory is a huge step, but the real test is applying it correctly. Even experienced operators can fall into common traps that lead to flawed data and poor decisions. Sidestepping these mistakes is crucial for turning your DIO from just a number into a powerful tool for growth.
One of the most frequent errors I see is using revenue instead of the Cost of Goods Sold (COGS) in the DIO formula. It might seem like a small detail, but it fundamentally distorts your calculation. Revenue includes your profit margin, which inflates the denominator and gives you an artificially low DIO. This can easily mask serious overstock issues. Always stick to COGS for an accurate picture of how efficiently you're turning inventory costs into sales.
Another major oversight is ignoring the impact of seasonality. A D2C brand selling swimwear will naturally have a much lower DIO in the spring than in the fall. If you only look at your annual DIO, you'll miss these critical fluctuations and could end up ordering heavy winter stock right before a summer slowdown.
Treating all your products the same is a recipe for trouble. Not every SKU moves at the same pace. Lumping your fast-moving bestsellers together with your slow-moving, long-tail items will give you a blended DIO that isn't truly representative of either category.
This is exactly why calculating DIO at the SKU level is so important. It helps you clearly identify:
By segmenting, you can create tailored strategies. For your hero products, you might increase safety stock to prevent stockouts. For your slow movers, you could plan a flash sale or bundle them with more popular items to clear them out. To successfully manage inventory and avoid common pitfalls, it's essential to implement effective stock and replenishment strategies that keep your inventory levels optimized.
Don’t let a single, blended DIO number hide the truth about your product portfolio. Digging into SKU-level data is where you’ll find the actionable insights that truly move the needle on profitability.
Safety stock is your buffer against unexpected demand spikes or supply chain delays. While it's a necessary part of inventory planning, getting the balance wrong can be costly. Too little safety stock, and you risk frustrating customers with stockouts. Too much, and you bloat your inventory, sending your DIO soaring and tying up cash.
Effective safety stock management isn't about guesswork. It requires a clear-headed look at two key variables:
By analyzing these factors for each key product, you can set safety stock levels that are just right—enough to protect you from uncertainty without creating unnecessary holding costs.
After calculating your DIO, it's tempting to set an aggressive goal to slash it. But aiming for an impossibly low number can be just as damaging as letting it get too high. An overly lean inventory can lead to frequent stockouts, which not only cost you sales but can also damage your brand's reputation.
A good DIO target is both ambitious and realistic. It should be based on:
Instead of just chasing a lower number, focus on consistency and gradual improvement. The goal isn't to have the lowest DIO possible, but to find the optimal balance that maximizes sales while minimizing the cash you have tied up in inventory. This strategic approach transforms DIO from a simple report card into a forward-looking guide for smarter purchasing and marketing decisions.
Once you get the hang of calculating your Days of Inventory, a few practical questions always pop up. Nailing down the answers to these is what separates knowing a metric from actually using it to gain an edge.
Let's break down the common questions I hear from D2C founders.
The real sweet spot here is a balance between having data that's fresh enough to act on and not drowning yourself in spreadsheets. For the vast majority of D2C brands, running your Days of Inventory Outstanding (DIO) numbers monthly is perfect.
A monthly check-in gives you a solid pulse on your inventory health. It's frequent enough to catch a negative trend—like a product that’s suddenly gathering dust—long before it becomes a cash flow crisis. This rhythm allows you to make smarter purchasing decisions for the upcoming month without getting lost in the noise of daily sales fluctuations.
If you’re just starting out or your sales are incredibly stable, a quarterly calculation might be enough. But honestly, a monthly analysis gives you a much richer story about how seasonality, a flash sale, or that new ad campaign is really impacting your stock levels.
Absolutely. While a high DIO is a classic sign of cash being tied up in unsold goods, a DIO that’s too low can be just as dangerous. The goal isn't to get this number as close to zero as possible. The goal is to find the optimal balance that keeps sales humming and customers happy.
An extremely low DIO is often a symptom of running too lean, and that comes with its own set of painful risks:
A very low DIO might look impressive on a spreadsheet, but it can be a disaster for your customer experience. The aim is efficiency, not scarcity. A healthy DIO means you have enough product to meet demand without getting crushed by carrying costs.
This is a great question because these two metrics are basically two sides of the same coin. They both measure your inventory efficiency, but they frame the story in slightly different ways.
Think of it like this: DIO tells you about time, while inventory turnover tells you about frequency.
They have a direct, inverse relationship—a high inventory turnover rate will always mean a low DIO, and vice-versa.
Using them together gives you the full picture. Knowing you turn your inventory 6 times a year is good. But knowing that translates to holding stock for 61 days (365 / 6) makes that insight far more tangible and actionable for planning your next purchase order.
Ready to stop wrestling with spreadsheets and get clear, automated insights into your inventory health? Tociny.ai connects directly to your Shopify store, automatically calculates your DIO, and provides actionable recommendations to reduce overstock and prevent stockouts. Join our private beta to see how AI-powered analytics can drive profitable growth for your brand. Learn more at https://tociny.ai.
Tociny is in private beta — we’re onboarding a few select stores right now.
Book a short call to get early access and exclusive insights.