
Calculating lead time is simply the total time it takes from the moment you place an order with your supplier to when that inventory is on your shelf, checked in, and ready to sell. It's so much more than just shipping time. Getting this number right is one of the most critical things you can do for your business—it directly impacts your cash flow, keeps customers happy, and is your best defense against the dreaded stockout.
Honestly, mastering this one calculation is the foundation of smart inventory management.
Picture this: your star product suddenly goes viral on TikTok. The orders are pouring in. It’s a dream come true! But that dream quickly turns into a nightmare when you realize your next shipment is still weeks out. That’s a classic stockout, and more often than not, it’s caused by misjudging the true lead time.
Really understanding this metric forces you to look beyond "shipping time" and see the entire journey your products take to get into your customers' hands.
A truly accurate lead time calculation accounts for every single step in your supply chain. Each stage has its own potential for delays, and if you miss just one, your entire inventory forecast can be thrown off.
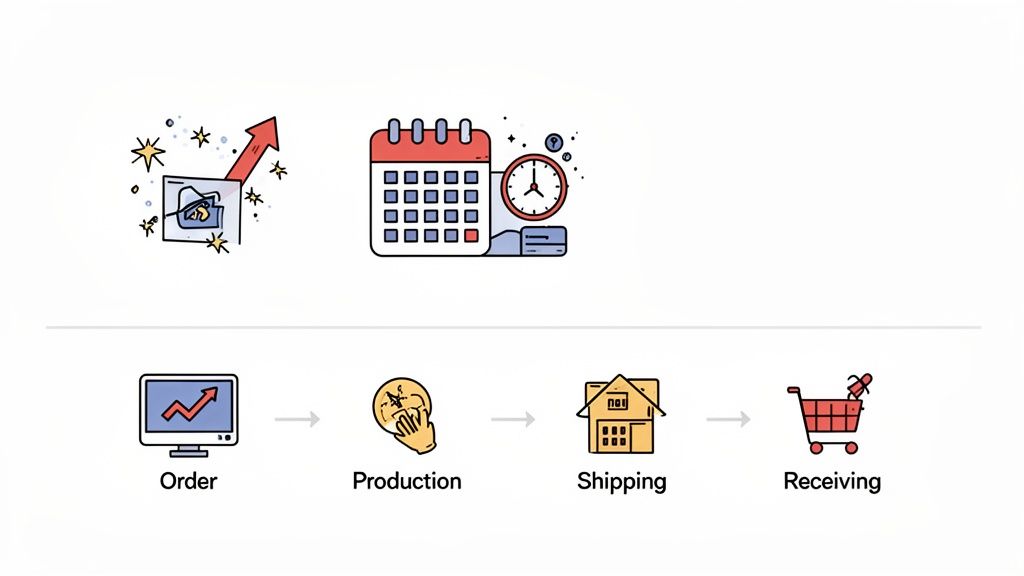
Here's a breakdown of the four pieces you absolutely have to track.
| Component | What It Includes | Why It Matters for Your Calculation |
|---|---|---|
| Order Processing | The time it takes your supplier to receive, confirm, and process your purchase order before any physical work starts. | This "admin lag" can vary wildly between suppliers. Is it 1 day or 5? That difference adds up fast. |
| Supplier Production | The manufacturing, assembly, or picking and packing time for your order. | For simple products, this might be a few days. For custom goods, it could be weeks or even months. It's often the biggest variable. |
| Shipping & Transit | The physical journey from your supplier's door to yours. This includes freight, port time, customs clearance, and local delivery. | This is what most people think lead time is, but it's just one piece. Customs delays alone can wreck your timeline. |
| Internal Receiving | The time your team takes to unload, inspect, count, and enter the new stock into your system so it's available for sale. | Don't forget this last mile! If stock sits on your receiving dock for three days, that's three days you can't sell it. |
Getting a handle on each of these stages separately is the only way to build a reliable total number for your inventory planning.
In the world of e-commerce, customer expectations are sky-high. Back in 2020, the average US e-commerce delivery was a sluggish 6.5 days. Fast forward to today, and that number has plummeted to just 2.47 days.
This isn't just a trend; it's the new standard. A staggering 74% of online shoppers now expect their order to arrive within two days. For direct-to-consumer brands, this means a stockout caused by a lead time miscalculation is a huge problem. In fact, a single late delivery makes 69% of shoppers less likely to buy from that brand again. You can find more supplier delivery time statistics on opensend.com.
Key Takeaway: Lead time isn't just some operational number on a spreadsheet. It's a direct driver of customer loyalty and profit. Getting it right lets you set realistic delivery promises, optimize your cash flow, and avoid losing sales to stockouts.
Alright, let's get down to the brass tacks. Moving from theory to practice with lead time isn't about buying fancy software; it's about using a couple of straightforward formulas and the data you already have. You just need to know where to look and how to piece it all together.
At its most basic, the lead time for any single past order is simply the time between when you paid for it and when it landed in your warehouse, ready to sell.
Lead Time = Order Receipt Date – Order Placement Date
This formula gives you a raw number in days for one specific purchase order. While it’s a great starting point, banking your entire inventory strategy on a single order is a recipe for disaster. One shipment that got stuck in customs or, conversely, arrived surprisingly fast can give you a completely skewed picture of what's normal.
To get a number you can actually trust for forecasting, you need to calculate an average lead time across a handful of recent purchase orders. This simple step smooths out the weird one-offs and gives you a much more realistic benchmark.
The formula is just as easy:
Average Lead Time = (Sum of All Lead Times) / (Total Number of Orders)
This approach provides a stable, dependable baseline for all your inventory planning. By averaging several orders, you naturally account for both the quick and the delayed shipments, which is exactly what you want.
So, where do you find the two key dates you need—Order Placement Date and Order Receipt Date? They're probably scattered across a few different places, but tracking them down is easier than you think.
Here are the usual suspects: * Supplier Invoices & Emails: Your PO email has the placement date. Your shipping confirmation or final invoice usually has the delivery date. * Your Shopify Admin: If you use Shopify to create purchase orders, the creation date is your starting point. * Shipping Carrier Confirmations: Check the emails or tracking pages from carriers like FedEx or UPS for the final "delivered" timestamp. * Warehouse Receiving Logs: This is the gold standard. If your team keeps a log—even a simple spreadsheet—of when new stock arrives and is checked in, this is your most accurate source for the receipt date.
The goal is to grab these two dates for the last 5-10 orders of a specific product. That gives you enough data to build a meaningful average without looking at ancient history that's no longer relevant.
A hard-won lesson: Always use the date your inventory is checked in and actually available for sale as your "Receipt Date." Don't just use the day the truck shows up. If boxes sit on your receiving dock for three days before being processed, that's part of your real lead time.
Okay, let's make this tangible. Imagine you sell a popular "Ceramic Coffee Mug" and you want to lock down its average lead time. You pull the data for your last five POs into a quick spreadsheet.
| Purchase Order # | Order Placement Date | Order Receipt Date | Lead Time (Days) |
|---|---|---|---|
| PO-101 | January 5 | January 20 | 15 |
| PO-102 | February 10 | February 28 | 18 |
| PO-103 | March 15 | March 28 | 13 |
| PO-104 | April 20 | May 8 | 18 |
| PO-105 | May 25 | June 11 | 17 |
First, for each order, you calculate the individual lead time by counting the days between placing the order and receiving it. I’ve already done that in the last column.
Next, you add up all those individual lead times: 15 + 18 + 13 + 18 + 17 = 81 total days
Finally, divide that total by the number of orders you looked at (in this case, 5): 81 days / 5 orders = 16.2 days
Boom. Your calculated average lead time for the Ceramic Coffee Mug is 16.2 days. Now you have a reliable number you can use to make much smarter decisions about when to place your next order, helping you dodge stockouts without tying up all your cash in excess inventory.
Real-world supply chains are rarely simple. A straightforward average calculation works beautifully when you have one product coming from one consistent supplier, but let's be honest—that’s rarely the case.
Once you start juggling multiple suppliers, working with dropshipping partners, or dealing with staggered deliveries, you need to get a bit more sophisticated with your lead time calculations. Nailing these complex scenarios is what separates the brands that just get by from the ones that truly scale. It keeps your inventory planning sharp, no matter how messy your logistics get.
The infographic below gives you a quick decision tree for picking the right calculation method.
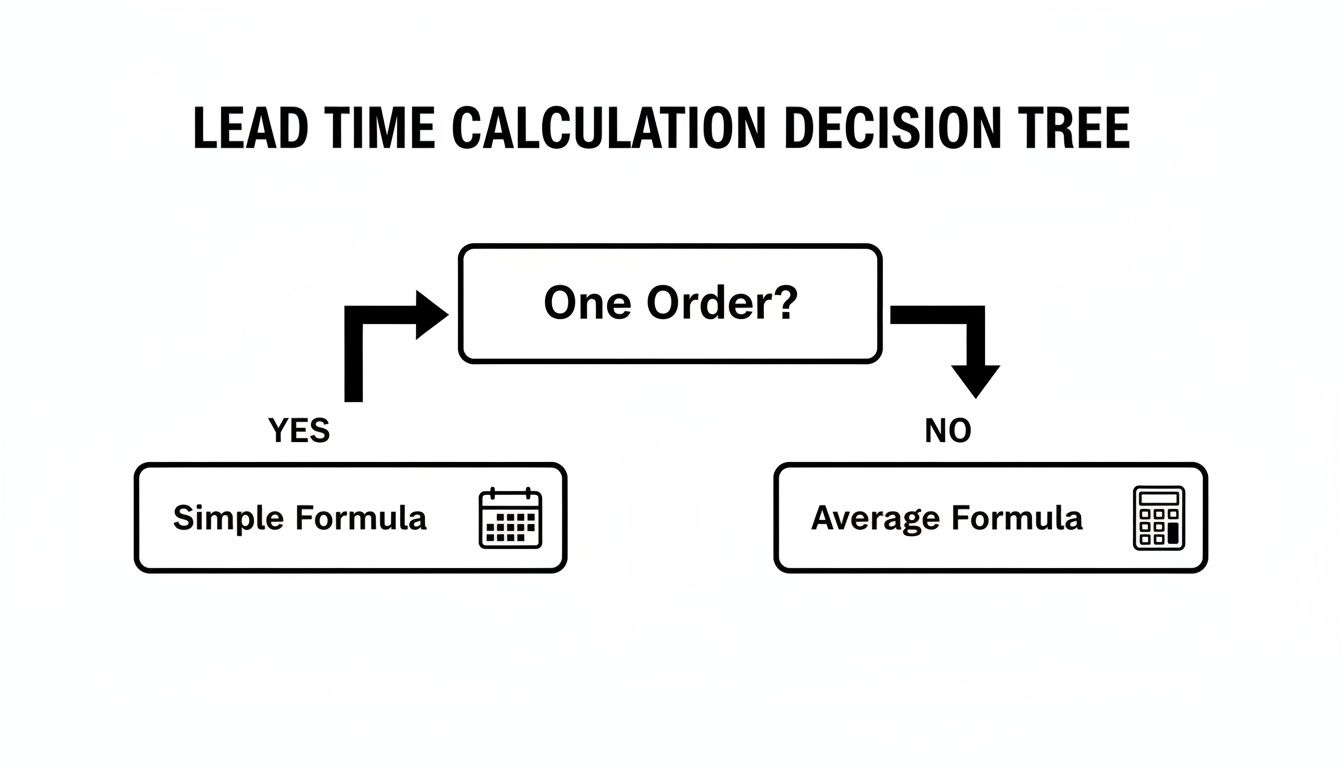
As you can see, the moment you move beyond a single, one-off order, using an average becomes the baseline for getting an accurate picture.
Sourcing a single SKU from more than one supplier is a smart way to de-risk your supply chain. The catch? It complicates your lead time math. Each supplier will have their own delivery speed and reliability, so a simple average just won't cut it. You need a weighted average lead time.
This approach factors in how much stock you actually order from each supplier, giving more "weight" to the partners you rely on most.
Let's imagine you source your best-selling "Performance T-Shirt" from two different factories: * Supplier A: They're faster but more expensive. They supply 30% of your units and have an average lead time of 15 days. * Supplier B: They're slower but much more affordable, supplying the other 70% of your units with a lead time of 25 days.
Here’s the formula:
(Supplier A % x Supplier A Lead Time) + (Supplier B % x Supplier B Lead Time)
Let's plug in the numbers:
(.30 x 15 days) + (.70 x 25 days) = 4.5 + 17.5 = 22 days
Your weighted average lead time is 22 days. If you had just averaged the two lead times, you'd get 20 days, an error that could easily lead to a stockout. This weighted figure gives you a far more reliable number for your reorder point calculations. For businesses managing even more intricate supply chains, specialized tools for AI Data Analysis can dig deeper to find hidden patterns and help manage these variables effectively.
What happens when you never physically touch your inventory? For dropshipping or third-party logistics (3PL) models, calculating lead time is just as critical, but the pieces of the puzzle change. Your "receipt date" isn't when boxes land at your warehouse; it's when your partner has the inventory checked in and ready to fulfill customer orders.
The lead time breaks down into these three key stages: 1. Supplier Production Time: The clock starts when your supplier begins manufacturing the goods. 2. Transit Time to 3PL: This is the time it takes for the shipment to travel from the factory to your 3PL's facility. 3. 3PL Receiving Time: Finally, this is how long your 3PL partner takes to receive, process, and make the inventory available to ship.
A skincare brand using a 3PL might see a timeline like this: * Production Time: 20 days * Transit Time: 7 days * 3PL Receiving: 3 days
Your total lead time here is 20 + 7 + 3 = 30 days. This is the number that matters. You need to provide it to your 3PL so their inventory management system can trigger reorder alerts at the right time.
Key Insight: In a 3PL model, your receiving process is outsourced. Always get a clear Service Level Agreement (SLA) from your 3PL on their receiving times. A partner that takes a week to process inbound stock dramatically inflates your real lead time, and you need to account for it.
It’s pretty common to place one large purchase order only to have your supplier send it in multiple, smaller deliveries. This happens a lot with big production runs or when shipping capacity is tight. So, how do you calculate lead time when an order arrives in pieces?
The rule of thumb is simple: use the date the last item from the purchase order is received.
Let's walk through an example. You place a PO for 1,000 units on July 1st: * Shipment 1: 400 units arrive on July 20th. * Shipment 2: 300 units arrive on July 25th. * Shipment 3 (Final): The last 300 units arrive on August 1st.
Your inventory isn't fully available to sell until that final shipment is checked in on August 1st. Therefore, your true lead time for this PO is 31 days (from July 1st to August 1st).
Using any earlier date would understate your lead time and could cause you to run out of stock before the full order is even on your shelves. Getting this right is absolutely essential for figuring out how much safety stock to carry. For a deeper dive, check out our guide on how to calculate safety stock.
To help you choose the right approach at a glance, we've put together a quick comparison of these methods.
The way you run your business directly impacts how you should calculate lead time. A simple average works for some, but dropshippers or businesses with multiple suppliers need a more tailored approach. This table breaks down the best calculation method for common e-commerce models.
| Scenario | Best Calculation Method | Key Data Points to Track |
|---|---|---|
| Single Supplier, Single SKU | Simple Average | Order Date, Receipt Date for multiple past orders |
| Multiple Suppliers, Single SKU | Weighted Average | Order Date, Receipt Date, Percentage of units from each supplier |
| Dropshipping/3PL Model | Sum of Components | Production Time, Transit Time, 3PL Receiving & Processing Time |
| Split Shipments | Total Time to Final Receipt | Order Date, Receipt Date of the last shipment in the order |
Ultimately, choosing the right formula comes down to understanding your specific supply chain. By tracking the right data points for your model, you can ensure your lead time calculations are as accurate and useful as possible, preventing stockouts and keeping your operations running smoothly.
Calculating your lead time is a fantastic first step, but the number itself doesn't actually change anything. Its real power comes alive when you plug it directly into your most critical inventory management decisions. Think of this metric as the engine that drives two of your most important levers for profitability: your reorder point and your safety stock levels.
Without an accurate lead time, you're essentially just guessing when to order more products. Once you have it, you can finally shift from reactive scrambling to proactive, data-driven planning.
Your reorder point is the inventory level that screams, "Time to order more!" It’s the specific threshold that, once your stock dips below it, triggers a new purchase order. The whole point is to place that order so new stock arrives just as you’re about to sell your last unit, preventing a painful stockout.
The classic formula for this is beautifully simple:
Reorder Point = Lead Time Demand + Safety Stock
This is where your lead time calculation becomes absolutely essential. Lead Time Demand is just the amount of stock you expect to sell while you're waiting for the new order to arrive. If your average lead time is 16 days and you sell 10 units a day, your lead time demand is 160 units. This tells you what to expect.
But we all know things don't always go as planned. That’s where safety stock comes in. It’s the extra buffer inventory you hold to protect yourself against surprises—either a sudden spike in sales or, more commonly, a supplier taking longer than expected.
A long and unpredictable lead time forces you to carry more safety stock, which means more of your cash is tied up in inventory just sitting on a shelf. On the flip side, a shorter, more reliable lead time lets you run a leaner operation with less safety stock, freeing up capital for marketing, product development, or other growth initiatives.
The Bottom Line: Your calculated lead time directly dictates how much inventory you must hold at any given time. A five-day reduction in lead time doesn’t just mean you get products faster; it means you can permanently lower the amount of cash tied up in your warehouse.
The stakes for getting this right are higher than you might think. Delays don't just annoy customers; they directly chip away at your profits. Some research shows that late deliveries can trigger a 1.1% increase in product returns for every single day an order is overdue. For anyone on Shopify, this is a massive deal, especially when you consider that 92% of customers factor delivery windows into their purchase decisions.
This direct link between lead time and profitability is precisely why so many brands are laser-focused on optimization. Nailing your lead time calculations is the foundational step for implementing the very best practices in inventory management that prevent these costly headaches in the first place.
Let’s walk through how a small change in lead time can create a significant financial impact. Imagine a D2C brand selling a popular skincare product.
Using the reorder point formula, their trigger point to order more stock is:
(25 days x 20 units/day) + 200 units = 700 units
This means they have to place a new PO every time their stock on hand drops to 700 units.
Now, let's say they work with their supplier and internal team to shave just five days off their lead time, bringing it down to a much better 20 days. With less uncertainty, they can confidently reduce their safety stock to 8 days of sales (160 units).
Their new reorder point becomes:
(20 days x 20 units/day) + 160 units = 560 units
By cutting their lead time by five days, they've lowered their reorder point from 700 to 560 units. That's a permanent reduction of 140 units of inventory they no longer need to keep on hand. If each unit costs them $10, that’s $1,400 in cash immediately freed up from just one single SKU. Multiply that across your entire catalog, and you can see how powerful this becomes.
For a deeper dive into these formulas, you can read our complete guide on how to calculate the reorder point.
Once you've got a solid handle on calculating your lead time, the real work begins: controlling it. The goal isn't just to measure how long things take; it's to actively shrink that timeline.
Every single day you can shave off your lead time reduces your need for costly safety stock and makes your entire operation more agile. This is where you move from just measuring to truly optimizing, and it’s a massive competitive advantage. You stop reacting to delays and start building a more bulletproof supply chain from the ground up.
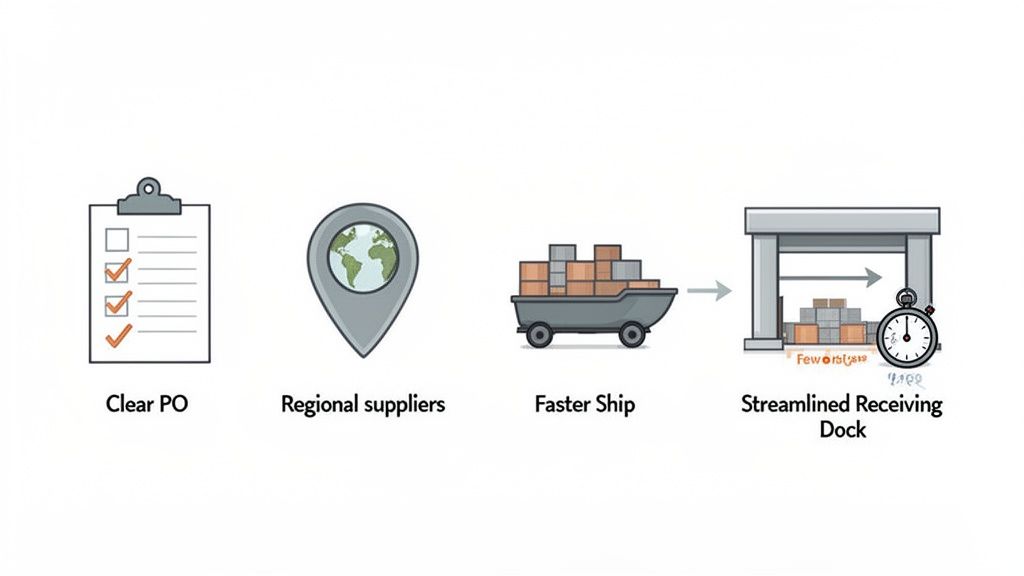
You'd be surprised how many delays start with a vague purchase order. When a supplier has to email you back and forth to figure out SKUs, quantities, or shipping details, you’re adding days to your "order processing" time before a single item is even made.
The fix is simple: create crystal-clear, standardized PO templates. Every single order should include:
This isn't just about good paperwork. It turns a casual request into an actionable command, cutting out the friction that costs you precious time.
Putting all your eggs in one basket with a single, distant supplier is a huge risk. A single port closure, shipping disruption, or even a regional holiday can unexpectedly add weeks to your lead time. Spreading your sourcing across different suppliers is one of the most powerful ways to protect your business.
Look into adding a secondary supplier in another part of the world. Even if their per-unit cost is a bit higher, the flexibility is often worth it. Better yet, find a domestic or nearshore supplier. Their shipping times will be drastically shorter, letting you place smaller, more frequent orders. This is a game-changer for your best-selling products where a stockout would be catastrophic.
Having an overseas supplier for your large, planned-out orders and a domestic partner for quick-turnaround restocks is a fantastic way to build resilience. This blended strategy drops your overall average lead time and lets you react to demand spikes without completely overhauling your supply chain.
Remember, the clock on lead time doesn't stop when a shipment arrives. It only stops when that inventory is checked in, counted, and officially available for sale in your system. A messy, disorganized receiving dock is a classic bottleneck that secretly inflates your lead time.
Map out your entire receiving process, from the moment a pallet hits the dock to the final stock entry in Shopify. Time each step. Where are the slowdowns? Can you pre-print labels? Can you rearrange the warehouse to cut down on how far your team has to walk?
Often, tiny process tweaks make a huge difference. Investing in a basic barcode scanner can easily cut your check-in time in half, turning the "internal receiving" portion of your lead time from days into hours. The best part? These internal gains are completely within your control. For a deeper dive on this, our article on understanding supply chain lead times breaks down how to optimize every single stage.
Even when you have the right formulas, things get tricky when you apply them to the real world. Calculating lead time isn’t always a straight line, and the little quirks in your supply chain can throw a wrench in the works.
Let's tackle some of the most common sticking points and questions that pop up when you start putting lead time calculations into practice. Think of this as your field guide for navigating the gray areas.
For most businesses, running the numbers quarterly is the sweet spot. This hits the right balance—it’s frequent enough to capture recent supplier performance and seasonal shifts, but not so often that it becomes a full-time job.
However, some situations demand an immediate update. Don't wait until the end of the quarter if something significant changes.
You’ll want to recalculate right away after events like: * Switching suppliers or freight carriers: New partners mean new timelines. Your old data is officially obsolete. * A major, unexpected delay: One huge hiccup can seriously skew your average, so it's best to analyze it and adjust immediately. * Changing your internal receiving process: If you've managed to speed up your check-in and putaway process, your lead time has improved! Your data needs to reflect that win.
For your absolute best-sellers—the products you simply cannot run out of—a monthly review is an even smarter move. With your most critical SKUs, the fresher the data, the better.
These two get mixed up all the time, but they measure completely different things. Getting this right is key to figuring out where your real bottlenecks are hiding.
Lead time is the big picture. It’s an external-facing metric that measures the entire waiting period from your perspective. It starts the second you send a PO to your supplier and doesn't end until those items are checked in and ready to be sold. Every single step, including all the waiting in between, is part of the lead time.
Cycle time, on the other hand, is an internal-facing metric. It zooms in on how long it takes your team to complete one specific task within your own four walls.
Think of it like a road trip. The lead time is the total time for the entire journey, from your driveway to your final destination, including every pit stop. A cycle time is just the time it takes to complete one leg of that trip, like driving from one city to the next.
For example, you might measure your "order picking cycle time" or your "inbound receiving cycle time." Both are small pieces that contribute to the overall lead time.
This is the classic dilemma when you're launching a new product or bringing on a new supplier. You’re starting with a blank slate.
Your first step is simple: ask the supplier. Get a formal, written lead time estimate from them. But don’t just settle for a single number. Ask for a breakdown of their production time versus their estimated shipping time. This gives you a bit more to go on.
Next, add a buffer. It’s always wise to add 20-30% on top of their initial estimate when you’re calculating safety stock and reorder points. Early shipments almost always hit snags as both sides are figuring out the new process.
Most importantly, start tracking from day one. As soon as that first PO goes out, the clock is running. Once you have three to five successful deliveries under your belt, you'll have enough real-world data to calculate your own preliminary average. At that point, you can ditch their estimate and start trusting your own numbers.
You can, but it's like playing with fire. If a supplier's delivery times are all over the place—15 days one time, 40 days the next—a simple average of 27.5 days is mathematically correct but practically useless. It gives you a false sense of security and is a recipe for frequent stockouts.
When you’re dealing with high variability, the average is only half the story.
In a situation like this, you absolutely need to calculate the standard deviation of your lead time. This number tells you exactly how much the delivery time typically swings away from the average. A high standard deviation is a massive red flag for unpredictability.
This metric is a crucial input for more advanced safety stock formulas. Put simply, a higher standard deviation will force you to carry significantly more safety stock to protect your business from that supplier's unreliability. The simple average hides the risk; the standard deviation brings it into the light.
Ready to move beyond messy spreadsheets for calculating lead time and reorder points? Tociny.ai uses AI to analyze your sales data, predict future demand, and provide clear, actionable inventory recommendations directly within your Shopify workflow. Stop guessing and start planning with confidence.
Tociny is in private beta — we’re onboarding a few select stores right now.
Book a short call to get early access and exclusive insights.