
Ever launched a huge marketing campaign, watched the sales pour in, and then realized your best-selling product is completely sold out? It's a gut-wrenching feeling, a nightmare scenario that costs ecommerce merchants real money and hard-won customer trust.
The key to avoiding this is to calculate the reorder point: the specific stock level that serves as an automatic trigger to order more inventory.
Think of your reorder point as the low-fuel light on your car's dashboard. It’s not just another number to track; it's the most critical early warning system for your inventory. Nailing this single calculation is what protects your revenue, keeps customers happy, and helps you dodge the two biggest inventory disasters:
A well-calculated reorder point strikes that perfect balance. It ensures you have enough stock on hand to meet demand without locking up precious capital in products that are just sitting there. It transforms inventory management from reactive, panic-driven buying into a predictable, proactive strategy.
I once worked with a Shopify store owner selling artisanal home goods who was constantly guessing when to restock. It was chaotic. One month, they'd have dusty boxes of unsold candles clogging their small warehouse; the next, their best-selling diffusers would be out of stock for weeks. The inconsistency was costing them thousands.
We sat down and took the time to properly calculate the reorder point for each and every SKU. It completely turned their operation around. They finally knew the precise moment to place new purchase orders, which eliminated stockouts during their peak seasons and freed up cash they'd previously wasted on slow-moving items. Their business became predictable and, more importantly, far more profitable.
This shift from guesswork to a data-driven system is the foundation of scalable inventory control. Your reorder point isn't just a number—it's the heartbeat of a healthy supply chain.
Just as it's crucial to understand your inventory needs, getting a handle on other key business calculations can seriously impact your bottom line. For instance, you can learn how to calculate shipping charges accurately to better manage logistics costs. This kind of holistic approach to your operational math is what builds a more resilient and profitable business.
At its core, figuring out when to reorder inventory isn't some mystical art. It comes down to a simple, yet incredibly powerful, formula. This is the bedrock of smart inventory management, the thing that separates proactive businesses from those constantly scrambling to put out fires.
Here’s the foundational formula we’ll be working with:
(Average Daily Sales × Lead Time) + Safety Stock = Reorder Point
This single line is your best defense against both stockouts and bloated, cash-draining warehouses. Let’s break down what each of these pieces actually means for your operations, moving beyond the textbook definitions.
Your Average Daily Sales is the engine of this whole calculation. It’s simply the average number of units of a specific product you sell each day. Get this wrong, and the entire formula falls apart.
To find this number, you need clean, reliable data. If you're on Shopify, this means diving into your analytics and pulling the sales data for an individual SKU. The trick is picking the right timeframe. Looking at just the last 30 days can be misleading because of random sales spikes or lulls. A full year might hide recent growth.
For most businesses, a 90-day period is the sweet spot—long enough to smooth out the noise but recent enough to reflect current demand.
For instance, say a home goods store sold 450 units of their popular "Coastal Breeze" candle over the last 90 days. Their average daily sales would be:
450 units / 90 days = 5 units per day
That number—5 units a day—is the heartbeat of customer demand for that specific product. If you want to get more sophisticated with predicting what's coming next, you can explore various demand forecasting methods in our detailed guide.
Before we move on, let's quickly organize these components into a handy table so you know exactly what you're looking for and where to find it.
| Component | Definition | Example Data Source |
|---|---|---|
| Average Daily Sales | The typical number of units sold per day for a specific SKU. | Shopify Analytics, ERP sales reports, Tociny.ai dashboard |
| Lead Time (in days) | The total time from placing a purchase order to stock being ready for sale. | Supplier communication records, warehouse receiving logs |
| Safety Stock (in units) | A buffer stock held to prevent stockouts from unexpected demand or delays. | Calculated based on variability (more on this later) |
This table acts as your quick-reference checklist. Once you have these three pieces of data, you're ready to calculate your reorder point.
Next up is Lead Time. This is where so many businesses get tripped up. It’s not just the shipping time. Your true lead time is the entire clock, starting from the second you send a purchase order (PO) until that new inventory is on your shelf, scanned in, and ready to be picked for a customer order.
This includes several steps people often forget:
Ignoring these "hidden" delays is a classic rookie mistake that leads directly to stockouts. If your supplier takes 2 days to process the order, shipping takes 10 days, and your warehouse team needs 1 day to get it ready for sale, your actual lead time is 13 days, not 10.
Finally, we have Safety Stock. Think of this as your inventory insurance policy. It’s the extra stock you keep on hand specifically to protect you from the unexpected. What if a TikTok video featuring your product goes viral? What if your supplier’s shipment gets stuck in customs? Safety stock is the buffer that keeps you selling.
For now, just think of it as a number we add to cover that uncertainty. We’ll get into the nitty-gritty of how to calculate this buffer with real precision a little later on.
By mastering these three inputs, you create a reorder point that reflects the true operational rhythm of your business, not just some theoretical model from a textbook.
Let's circle back to our home goods store and their "Coastal Breeze" candle. They've done their homework and have their numbers ready:
Now, let's plug these into the formula:
(5 units/day × 13 days) + 30 units = 95 units
The reorder point is 95. Simple as that. This means the moment their on-hand inventory for this candle hits 95 units, an alert should fire off to place a new PO. This timing ensures the new shipment arrives just as they start dipping into their safety stock, preventing any interruption in sales.
This isn't just theory; it has a massive real-world impact. Research from a few years back showed that e-commerce businesses that got this right reduced stockouts by a staggering 45%. That, in turn, boosted customer satisfaction scores by an average of 28% and eliminated the need for panicked, expensive rush orders that can cost 20-30% extra in shipping. You can read more about these reorder point findings to see just how powerful this one calculation can be.
The first half of our reorder point formula—lead time demand—is pretty straightforward. It's the inventory you fully expect to sell while you're waiting for the next shipment to arrive. That’s the predictable part.
But what about the messy, unpredictable parts of running a business? What happens when a supplier’s truck breaks down, a container gets stuck at port, or a surprise mention from an influencer wipes out your projected stock in a single afternoon? This is exactly where safety stock comes into play.
Safety stock isn't just "extra inventory" you keep on hand for a rainy day. It's a calculated, strategic buffer designed to absorb the real-world shocks of variability—both in customer demand and supplier lead times. Moving beyond simple guesswork for this number is what separates businesses that are constantly scrambling from those that operate with confidence. To truly nail your reorder point, you have to master the art of safety stock.
This visual shows how each piece—daily sales, lead time, and safety stock—feeds into the final reorder point.
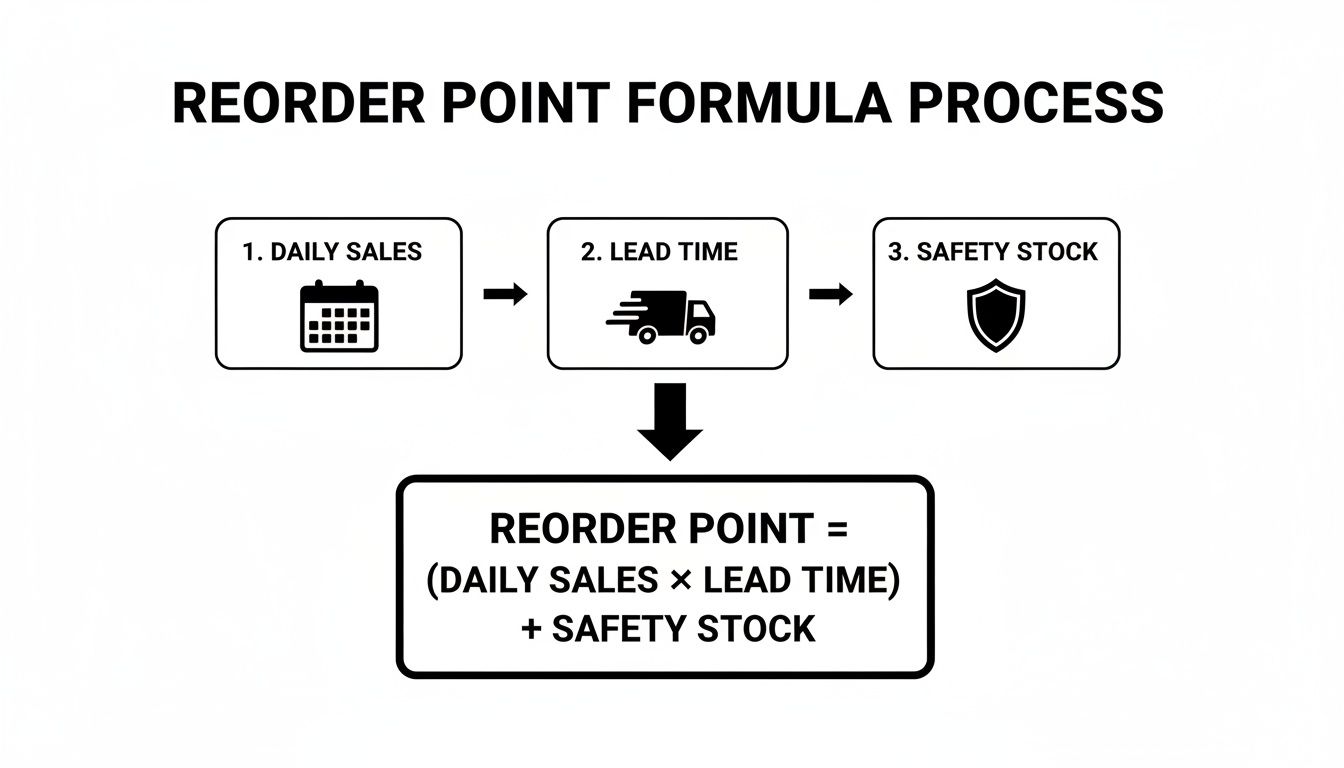
The key takeaway here is that safety stock isn't an afterthought. It's a core pillar of the entire formula, acting as your shield against the unexpected.
Before we can even think about calculating safety stock, we have to make a decision about our desired service level. It’s a simple but powerful concept: what percentage of the time do you want to be in stock and ready to fulfill an order?
While a 100% service level sounds like the dream, it would require an infinite amount of safety stock, which is obviously impossible. Instead, we aim for a realistic target. A common and healthy service level is 95%. This means you’re accepting a 5% chance of stocking out before your next shipment arrives.
For your absolute best-selling "A-list" products, you might push for 98% or even 99%, since a stockout would be incredibly costly. For your slower-moving "C-list" items, a 90% service level might be perfectly acceptable.
Your chosen service level translates directly to a statistical value known as a z-score. This score simply represents how many standard deviations away from the average you want to be protected. You don't need to get lost in the complex math; you just need to know which z-score matches your target.
Here’s a quick reference table for the most common service levels:
| Service Level | Stockout Risk | Z-Score |
|---|---|---|
| 90% | 10% | 1.28 |
| 95% | 5% | 1.65 |
| 98% | 2% | 2.05 |
| 99% | 1% | 2.33 |
Choosing a higher service level means a higher z-score, which in turn means you'll hold more safety stock. It's a direct trade-off between the cost of holding inventory and the cost of a potential stockout.
Now, we need a way to measure the very thing we're protecting against: variability. The best tool for this is the standard deviation of both your daily sales and your lead time. In simple terms, standard deviation is a statistical measure of how spread out your numbers are from the average.
A low standard deviation means your sales (or lead times) are very consistent. Predictable. A high standard deviation means they are all over the place—volatile and hard to forecast. It's this volatility that makes safety stock so critical.
Let’s imagine a consumer electronics brand selling a popular set of noise-canceling headphones. Over the past week, their daily sales looked like this: 10, 15, 8, 22, 12, 18. The average is 14.17 units per day, but that simple average doesn't capture the wild swings from 8 to 22.
Calculating the standard deviation (which you can do in any spreadsheet with a function like =STDEV.S()) reveals the true volatility in their demand. This number, combined with the z-score from your service level, becomes the engine of a precise safety stock calculation. If this sounds a bit complex, our guide on how to calculate safety stock breaks down the step-by-step math in even greater detail.
By quantifying the "unpredictability" in your sales and supply chain, you transform safety stock from a hopeful guess into a calculated defense against real-world chaos.
With our service level (z-score) and our measure of variability (standard deviation) in hand, we can now use a standard industry formula to find the right amount of safety stock. While there are a few variations out there, a common and effective one looks like this:
Safety Stock = Z-Score × Standard Deviation of Sales × √Average Lead Time
Let's apply this to our electronics brand example.
Now, we just plug these values into the formula:
1.65 (Z-Score) × 5.4 (Std Dev of Sales) × √10 (Square Root of Lead Time)
1.65 × 5.4 × 3.16 = 28.1 units
They should round this up to 29 units. This is their data-driven safety stock. It’s not a number pulled from thin air; it’s a specific buffer calculated to give them a 95% chance of staying in stock even when demand spikes. This 29-unit buffer will be added to their lead time demand to get the final reorder point, ensuring they have a robust shield against uncertainty.
Theory is great, but let's get our hands dirty. The best way to understand how these numbers click into place is to walk through a real-world scenario.
We'll follow a fictional Shopify health and wellness brand, "VitaBoost," as they calculate the reorder point for their top-selling product: a premium vitamin C supplement. This will tie everything together—average sales, lead time, service levels, and safety stock—into one final, actionable number.
First things first, the VitaBoost team needs accurate data. They know that if they start with junk numbers, they'll end up with a junk reorder point. So, they pull up their Shopify reports and check in with their warehouse manager.
They look at the last 90 days of sales history, which gives them a solid, recent picture of demand. In that time, they sold 2,700 bottles.
Next, they dig into past purchase orders to nail down their actual lead time. It’s not just shipping time. They find their supplier averages 3 days to process an order, shipping takes another 10 days, and their own warehouse needs 1 day to receive the shipment and get it on the shelves.
Finally, they need to account for the real-world messiness of demand and supply chains. Nothing is ever perfectly consistent.
This vitamin C supplement is an "A-item" for VitaBoost—it's a bestseller and a customer favorite. A stockout would be a disaster for both revenue and loyalty. Because of this, they set an aggressive service level.
A 98% service level means they're aiming to have the product in stock and ready to ship 98% of the time, accepting a 2% risk of stocking out before the next shipment arrives. A quick look at a standard z-score table connects this percentage to a statistical value.
This number is the key multiplier for their safety stock. The higher the desired service level, the higher the z-score, and the bigger the safety buffer.
Now VitaBoost has everything needed to calculate a data-driven safety stock. They’re using the full formula that accounts for variability in both sales and lead time—this is the most robust way to do it.
The formula is: Safety Stock = Z-Score × √((Avg Lead Time × Std Dev of Sales²) + (Avg Daily Sales × Std Dev of Lead Time)²)
Let's plug in their numbers:
They round this up to 138 bottles. This isn't a random guess. It's a precisely calculated buffer designed to protect them from 98% of unexpected demand spikes and supplier delays.
With the safety stock calculated, the final step is a simple one. They just need to plug it back into the main reorder point formula.
Reorder Point = (Average Daily Sales × Average Lead Time) + Safety Stock
Putting in the final numbers:
And there it is: 558. This is VitaBoost’s trigger. The moment their inventory level for this supplement hits 558 units, it’s time to send a new purchase order to their supplier. This isn't guesswork; it's a data-backed process to ensure they reorder at the perfect moment.
The impact of this precision is immense. A 2022 Forrester Research report found that retailers who master these formulas can cut excess inventory by 52%. For small e-commerce brands, this often leads to profit margin jumps of around 18%. Discover more insights about these inventory management findings.
To make this immediately useful, you can copy this Google Sheets Reorder Point Calculator with all the formulas pre-built. Just plug in your own numbers to calculate the reorder point for your products.
Look, starting with a spreadsheet for your inventory calculations is a fantastic first step. Seriously. It forces you to get your hands dirty with the numbers, understand the variables that make your business tick, and gives you a real sense of control.
But that trusty spreadsheet has a ceiling. Once you grow from a handful of SKUs to dozens—or even hundreds—it quickly goes from being a helpful tool to a major bottleneck.
The simple truth is that manual methods are always playing catch-up. They’re slow, incredibly vulnerable to human error (one bad formula can throw everything off), and completely static. A reorder point you figured out in January could be wildly off by March, but your spreadsheet has no way of telling you that. It can’t adapt to market shifts, sudden spikes in demand, or subtle seasonal changes on its own.

This is exactly where AI-powered platforms change the entire game. Instead of you manually exporting CSVs and plugging in numbers, these tools sync directly with your Shopify store’s sales data in real time. They don't just calculate a simple average from last month's sales; they analyze trends, seasonality, and demand swings with a level of detail that’s impossible to match manually.
An AI system can spot that a particular product is picking up steam and adjust its forecast on the fly, recommending a higher reorder point before you even realize a trend is forming. On the flip side, it can flag items that are moving slower than molasses, stopping you from ordering more stock that’s just going to gather dust and tie up your cash. This dynamic, living calculation is the key difference.
AI doesn't just calculate the reorder point once; it continuously recalculates it for every single SKU in your catalog based on the latest data. This transforms a complex quarterly chore into a seamless, automated part of your daily workflow.
The real magic of this automation is how it shifts your entire process from reactive to proactive. Instead of you needing to remember to check inventory levels, the system is always watching for you. Modern platforms like Tociny.ai send intelligent, timely alerts right to you, turning raw data into an immediate, actionable step.
Think about what this looks like in the real world, all handled automatically:
This leap forward moves you from being an inventory data clerk to a strategic decision-maker. While spreadsheets are a valuable first step—and our guide on building an inventory tracking spreadsheet is a great place to start—scaling your business demands a more powerful solution. To get a broader perspective on how this technology works, check out this excellent resource on AI automation for business. This is how you scale your inventory strategy without getting buried in endless calculations.
As you start plugging numbers into the reorder point formula, you'll quickly realize that inventory management isn't just about math. It's about applying those formulas to the messy, unpredictable nature of a real business. Let's tackle some of the most common questions that come up when merchants start fine-tuning their inventory strategy.
Think of your reorder point as a living number, not a "set it and forget it" metric. For your core, steady-selling products, a quarterly review is a pretty solid baseline. That's usually frequent enough to catch major shifts in demand or supplier performance without burying you in administrative work.
But for your more volatile items, you’ll need to be more on top of it.
The real key is to update your inputs—your average sales and lead times—whenever you notice a significant trend change. Staying agile is the name of the game.
Inconsistent supplier lead times are more the rule than the exception, and this is exactly why a data-driven safety stock calculation is so critical. When a supplier is all over the map, just guessing at a buffer stock will leave you dangerously exposed to stockouts.
Instead of guessing, you need to quantify that inconsistency. Start tracking the actual delivery time for every single purchase order. This isn't just about finding your average lead time; it’s about calculating the standard deviation of your lead time. A higher standard deviation means more unpredictability, which will directly (and correctly) increase the safety stock your formula recommends. This gives you a much bigger buffer to absorb those frustrating delays.
An inconsistent supplier doesn't just make logistics a headache; it directly inflates your carrying costs. The more safety stock you're forced to hold as insurance, the more cash is just sitting on your shelves instead of working for you.
Trying to apply a standard, year-round reorder point formula to a seasonal product is a recipe for disaster. If you use a 12-month average daily sales figure for a Christmas ornament, you're guaranteed to be swimming in unsold stock come February.
The fix is simple: use a relevant, season-specific time frame for your sales data. To calculate the reorder point for a seasonal item, you should look exclusively at the sales data from the last peak season. For instance, if you're planning for this year's summer rush, calculate your "average daily sales" using only the data from last June, July, and August. This will give you a forecast that’s actually grounded in reality.
Choosing a service level is a strategic balancing act between inventory costs and the risk of lost sales. A 95% service level is a widely accepted industry standard and an excellent starting point for most of your core products. This means you're comfortable with a 5% chance of stocking out before your next shipment arrives.
But you don't have to use a one-size-fits-all approach. A smarter way is to segment your inventory:
Manually tracking all these variables for every single SKU is a monumental time sink. Tociny.ai automates these complex calculations by syncing directly with your Shopify data. It provides dynamic reorder points and proactive alerts so you can stop guessing and start scaling your business with confidence. Discover how AI can optimize your inventory at Tociny.ai.
Tociny is in private beta — we’re onboarding a few select stores right now.
Book a short call to get early access and exclusive insights.