
Ever found yourself staring at shelves overflowing with products that just aren't selling? That’s excess inventory, and it’s a far bigger problem than just a crowded stockroom. Think of it as cash trapped in cardboard boxes.
This surplus stock is any product you have on hand that outstrips what your customers are likely to buy in the foreseeable future. It’s a silent business killer, tying up your capital, driving up hidden costs, and running the risk of becoming completely worthless before you ever get a chance to sell it.
It helps to think of your warehouse as a financial portfolio. Each product is an investment you've made, and you need that investment to pay off. When products just sit there, they become stagnant assets that actively drain money from your business instead of making it. That's the real headache of excess inventory.
A lot of merchants get tripped up by only looking at the obvious costs, like the monthly warehouse bill. But the true financial damage from overstocking runs much, much deeper. These sneaky "carrying costs" are constantly chipping away at your profits from multiple angles.
Carrying costs are the sum of all expenses tied to holding onto that unsold inventory. It's a significant, often invisible, financial weight that drags down your bottom line. Here’s what those costs typically include:
Inefficient inventory management is a staggering global problem, costing businesses an estimated $1.1 trillion every year. For retailers, overstocking alone is responsible for about $471 billion in losses annually, with carrying costs sometimes soaring as high as 41% of a product's value. You can get more perspective on these global inventory challenges from the experts at Ligentia.
When you see all these factors laid out, it’s clear that tackling excess inventory isn't just an operational task—it’s a fundamental financial strategy. By getting your stock levels right, you free up cash, slash your risks, and set your business up for much healthier, more sustainable growth.
Excess inventory rarely just appears out of nowhere. It’s almost always the result of small, seemingly unrelated issues that quietly snowball over time, eventually creating a perfect storm of overstock.
If you look past the simple answer of "we ordered too much," you'll usually find deeper, systemic problems that even the sharpest businesses can miss. Getting to the bottom of these root causes is the first real step toward building a more resilient operation.
Most inventory problems start with a fuzzy picture of the future. Inaccurate demand forecasting is probably the single biggest driver of surplus stock. When a business overestimates what sales will look like—maybe because of some seasonal optimism or just misreading market trends—it inevitably buys more inventory than customers actually want. Right away, you’ve created an imbalance that’s tough to unwind.
This forecasting headache can get a lot worse when the market makes a sudden, dramatic shift. Think back to the COVID-19 pandemic. Consumer spending pivoted hard from services to goods, causing a massive spike in demand for physical products. Retailers scrambled to restock, leading to record-high wholesale inventory growth. But as consumer behavior started shifting back, many were left holding way more stock than they needed. The St. Louis Fed has some great data on these widespread inventory mismatches if you want to dig deeper.
Another huge cause is a simple breakdown in communication across the supply chain. When your purchasing, marketing, and sales teams are all operating in their own silos, they create conflicting signals. Your marketing team might be planning a massive promotion without telling the procurement team, leading to a stockout. The next step? A panicked over-order to compensate, and the cycle begins.
This kind of disconnect is what often triggers the bullwhip effect. Imagine a small flicker of extra demand from a customer. The retailer sees it and places a slightly larger order with their supplier, just to be safe. The wholesaler sees that larger order and bumps it up even more when ordering from the manufacturer.
The bullwhip effect describes how small fluctuations in demand at the retail level can cause progressively larger fluctuations in demand at the wholesale, distributor, manufacturer, and raw material supplier levels.
This ripple of ever-increasing order sizes travels all the way up the supply chain. Before you know it, the manufacturer is churning out far more product than the original customer demand ever justified.
Finally, your own internal strategies can be the direct cause of excess inventory. Chasing supplier discounts is a classic trap. Sure, buying in bulk to lock in a lower per-unit cost seems like a smart financial move. But it's a terrible decision if those products just end up sitting on a shelf for months, racking up carrying costs that completely wipe out any initial savings.
In the same vein, poor product assortment planning is a major contributor. Offering too many variations (SKUs) of a single product can cannibalize sales from your core bestsellers and spread your inventory investment way too thin. Without a clear process for regularly reviewing and trimming down your product catalog, you risk accumulating a long tail of slow-moving items that quietly bleed profitability and clog up your warehouse.
Before you can fix an overstock problem, you have to know how big it really is. Guesswork won't get you very far; you need to dig into the data and see exactly where the dead weight is hiding. Quantifying your excess inventory is the first real step toward getting your stock levels back into a healthy, profitable rhythm.
This isn't just about crunching numbers. It’s about pairing hard data with what you’re seeing on the ground every day. When you combine key performance indicators (KPIs) with a few qualitative red flags, you get a complete, honest picture of your inventory health.
To get started, there are a couple of powerhouse KPIs that will immediately shine a light on any potential excess inventory: the Inventory Turnover Ratio and Days Sales of Inventory (DSI). Think of them as two sides of the same coin, telling a story about how efficiently you turn your products into cash.
Inventory Turnover Ratio: This metric tells you how many times you sell through your entire stock in a given period (usually a year). A low number here is a major red flag. It’s a sign that products are collecting dust on your shelves instead of flying out the door. To get a handle on your own numbers, you can dive deeper with our guide and use our handy inventory turnover ratio calculator.
Days Sales of Inventory (DSI): This KPI makes the turnover ratio a bit more concrete. It calculates the average number of days it takes for you to sell your stock. A high DSI is a cash flow killer. It means your capital is stuck in slow-moving products for way too long.
While these numbers give you a solid baseline, they don't always tell the why. The infographic below points to some of the usual suspects behind poor inventory performance.
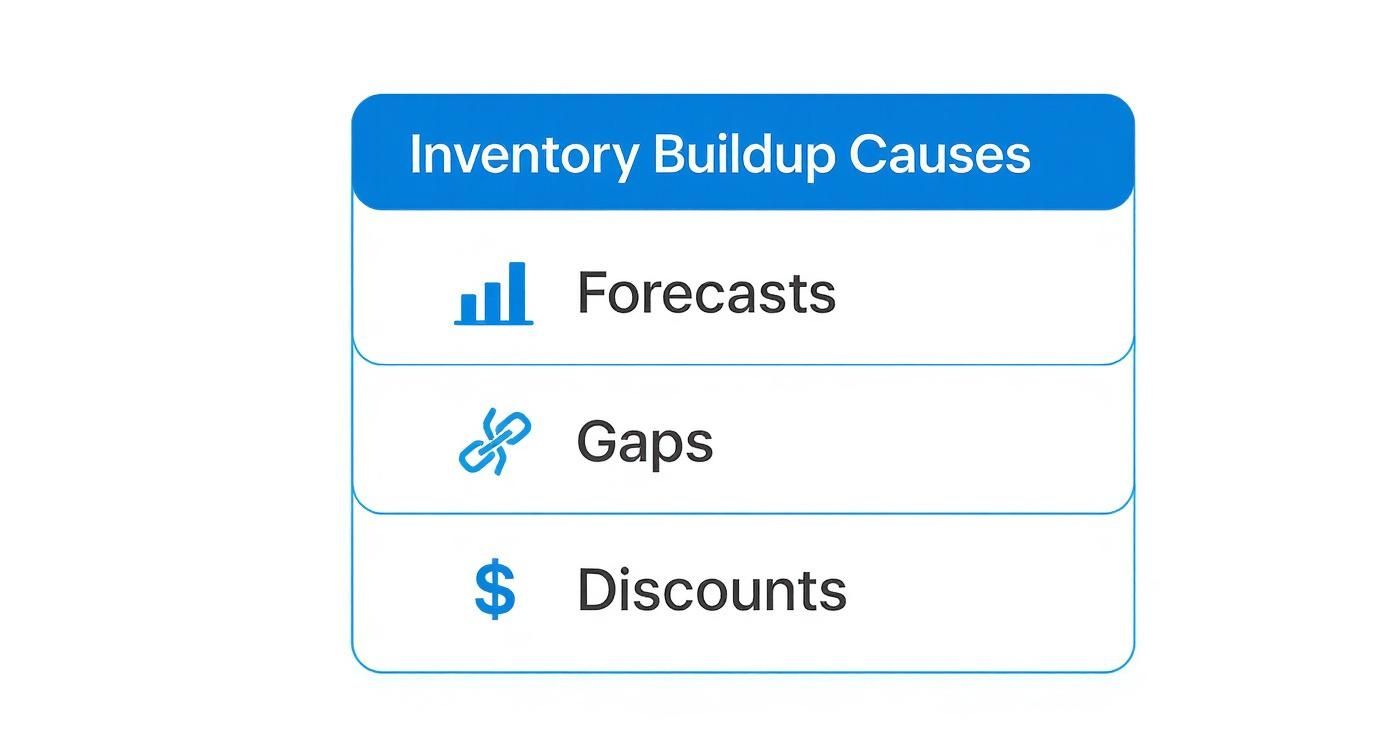
As you can see, things like bad forecasts, supply chain hiccups, or even chasing supplier discounts can directly lead to the weak KPI results you might be seeing on your reports.
When you're ready to start diagnosing your inventory health, a few key metrics can guide your analysis. Each one offers a different lens through which to view your stock's performance.
| Metric | What It Measures | High vs. Low Indicates | When to Use It |
|---|---|---|---|
| Inventory Turnover Ratio | How many times you sell and replace your inventory in a year. | Low: Products are sitting too long. High: Strong sales or understocking. | For a high-level annual health check of overall efficiency. |
| Days Sales of Inventory (DSI) | The average number of days it takes to turn inventory into sales. | High: Capital is tied up in slow-moving stock. Low: Quick sales cycle. | To understand the direct impact of inventory on your cash flow. |
| Sell-Through Rate | The percentage of units sold versus the number of units received. | Low: You've over-ordered for a specific product or category. High: Popular item. | Best for evaluating the performance of new products or seasonal items. |
| Carrying Cost of Inventory | The total cost of holding unsold inventory (storage, insurance, etc.). | High: Excess stock is actively draining your profits. Low: Healthy stock levels. | To quantify the direct financial drain of your overstock situation. |
By tracking these KPIs together, you can move from simply suspecting you have an overstock problem to knowing exactly where it is and how much it's costing you.
Sometimes the clearest signs of an inventory problem aren't on a spreadsheet at all. You can often feel an overstock issue just by walking through your warehouse or looking at your marketing calendar. These qualitative signals are powerful early warnings that shouldn't be ignored.
A quick walk through your warehouse can be just as revealing as a deep data dive. Are aisles getting tighter? Are boxes gathering dust? Those are physical clues that your inventory levels are out of sync with what customers actually want.
Keep an eye out for these tell-tale signs:
Okay, so you’ve identified the dead weight in your inventory. Now what? The next step is taking decisive action. Getting rid of overstock is all about a smart, surgical approach that protects your brand’s reputation while freeing up that precious warehouse space and cash. The goal isn’t just to dump it; it’s to move it strategically.
Luckily, there’s a whole playbook of tactics you can pull from. The right move depends on your products, your profit margins, and just how fast you need that inventory gone. Let's walk through some of the most effective ways to turn those surplus goods back into healthy cash flow.
One of the most direct ways to clear the shelves is through targeted sales. But this goes way beyond just slapping a discount sticker on something. It’s about creating a sense of urgency and genuine value for your customers.
Bundling is a classic psychological win. It lets you move those slow-selling items by pairing them up with your popular, high-demand products. This instantly increases the perceived value of the whole package and introduces customers to items they might have otherwise ignored.
Imagine a skincare brand with a face mask that just isn't moving. They could bundle that excess stock with their bestselling moisturizer and sell it as a "Complete Hydration Kit" at a can't-miss price. Suddenly, that slow-mover feels like an essential part of a must-have set.
The struggle with overstock is real and it's widespread. In the U.S. retail world, the average number of days inventory sat on shelves jumped by 12% since 2021. Big players have had to get aggressive with markdowns and even order cancellations to get things back under control. You can dive deeper into how industry leaders are tackling the hidden costs of excess inventory on alixpartners.com.
Sometimes, selling directly to your main customer base isn't the right call, especially if you’re trying to protect a premium brand image. When that's the case, turning to alternative channels can be a discreet way to offload that extra stock.
Before you resort to liquidation, it’s always a good idea to step back and look at your entire product catalog. A process called SKU rationalization helps you pinpoint and cut the underperforming products that are constantly causing your overstock headaches in the first place. You can learn more about this preventative strategy in our guide on what is SKU rationalization.
Clearing out a mountain of overstock is a necessary evil, but what if you could stop that mountain from forming in the first place? That’s where the real power lies. Shifting from reactive fire-fighting to a proactive prevention strategy is the secret to long-term inventory health and, frankly, better profits.
It's about moving away from guesswork and gut feelings. The goal is to build a smart, data-driven replenishment process that orders what you need, right when you need it—and not a single unit more. This isn't about wrestling with complex formulas; it’s about putting a few foundational inventory techniques to work for your business.
A truly proactive system starts by knowing exactly when to reorder. This is where two critical concepts come into play: reorder points and safety stock.
Reorder Point (ROP): This is the specific stock level that should kick off a new purchase order. A static reorder point—like "order more when we have 50 units left"—is a recipe for disaster. It doesn't adapt. A dynamic ROP, on the other hand, considers your current sales velocity and your supplier's lead time, ensuring you place orders at the perfect moment.
Safety Stock: Think of this as a small, strategic buffer of extra inventory you keep on hand. It's there to protect you from unexpected spikes in demand or a shipment that gets stuck in transit. It’s your insurance policy against stockouts, but you have to calculate it carefully. Too much safety stock, and it just becomes another form of excess inventory.
Your reorder point is the yellow light telling you it’s time to prepare to stop (or reorder). Your safety stock is the extra braking distance you leave yourself, just in case the car in front of you slams on its brakes.
By setting these triggers based on real data, you stop ordering out of fear and start making precise, timely purchasing decisions. This simple shift is your first line of defense against creating excess inventory.
Let’s be honest: not all of your products are created equal. So why would you manage them all the same way? ABC analysis is a simple but powerful method for categorizing your inventory based on its value, letting you focus your attention where it really counts.
Here’s the typical breakdown:
By applying this framework, you can dedicate your most valuable resource—your time—to the products that actually move the needle. You'll build a smarter, more efficient system that actively prevents overstock on the items that matter most to your bottom line.

Let's be honest, traditional forecasting can feel a bit like trying to predict the weather with last year's almanac. You’re relying on historical sales data, which is useful, but it’s a rearview mirror approach. It just can't keep up with all the fast-moving variables that drive sales in modern e-commerce.
This is where AI and machine learning change the game. Instead of just guessing, you can build a proactive strategy.
AI algorithms don't just look backward; they analyze massive, complex datasets in real time. They dig deeper than your own sales history, catching subtle patterns and correlations that a human analyst would almost certainly miss.
Think of AI-driven forecasting as a powerful digital brain for your inventory. It connects the dots between past sales, current market trends, and even external factors like social media buzz to create a much clearer picture of what's coming next.
This allows AI to predict sales with a stunning level of precision. It’s your best defense against the slow, silent buildup of excess inventory.
Picture a Shopify store that sells trendy athletic apparel. Manually forecasting for the next season is a massive headache. The team has to guess how a new colorway will perform, try to anticipate the impact of a competitor's sale, and account for all the usual seasonal demand shifts. It’s a lot of guesswork.
Now, bring in an AI-powered analytics app like Tociny.ai. It automates and sharpens this entire process. The system looks at everything at once:
By crunching all these signals together, the AI might recommend a larger-than-usual order for those trail running shorts but advise caution on a color trend that’s starting to fade. This turns inventory planning from a manual chore into a data-backed strategic advantage.
If you want to go deeper on this, our post on improving demand forecasting accuracy breaks it down even further.
When you're dealing with an excess of inventory, a lot of questions tend to pop up. Let's clear up some of the most common ones so you can build a smarter, more profitable inventory strategy.
There's no single magic number here—it really hinges on how fast your products sell. But as a solid rule of thumb, you should be doing a deep dive at least once per quarter.
For your rockstar products, the "A-Items" that fly off the shelves, you'll want to check in weekly, if not daily. That's the only way to stay ahead of both stockouts and surprise overstocks. Your slower-moving items? A monthly review should do the trick.
It all comes down to potential. Think of it this way:
The real distinction is that excess inventory is a cash flow problem you can solve. Obsolete inventory, on the other hand, is usually a loss you just have to write off.
If you're a small business just starting to get a handle on your excess inventory, the single most powerful first step is getting data visibility. You can't fix what you can't see.
Forget about expensive software or complicated formulas for a moment. Just open up your sales platform (like Shopify) and pull a report of your slowest-moving products over the last 90 days. This simple action gives you a clear, data-backed list of where to start your liquidation efforts. No big budget required.
Ready to stop guessing and start making data-driven inventory decisions? Tociny.ai uses AI to give you clear visibility into your stock levels, predict future demand, and provide actionable recommendations to eliminate overstock. Get early access and build a more profitable inventory strategy today at https://tociny.ai.
Tociny is in private beta — we’re onboarding a few select stores right now.
Book a short call to get early access and exclusive insights.