
If you've ever felt the sting of a surprise stockout or the pain of cash tied up in dusty, unsold products, you're not alone. Every Shopify merchant grapples with this balancing act. This is where safety stock comes in—it’s not just some accounting term, but a powerful tool for boosting profitability and keeping customers happy in the hyper-competitive world of ecommerce.
Think of it as your store's insurance policy against the unpredictable.
So, how do you figure out the right amount? A straightforward starting point is the classic safety stock formula:
(Maximum Daily Sales × Maximum Lead Time) – (Average Daily Sales × Average Lead Time)
This calculation gives you a basic buffer to guard against unexpected sales spikes or frustrating supplier delays. It's the first step toward making sure you don't run out of stock and leave money on the table.
Let's paint a picture. You run a wellness brand, and out of the blue, a major influencer mentions one of your supplements. Orders flood in, multiplying your daily sales by 300% overnight.
Without a smart inventory buffer, you'd sell out in hours. You'd be left scrambling, disappointing a wave of new customers and missing a massive growth opportunity. But with the right safety stock, you capture that viral moment, turning sudden demand into sales, not apologies.
This buffer is designed to protect your business from the two biggest inventory risks: * Demand Variability: Those sudden spikes in customer orders driven by trends, seasonality, or a killer promotion. * Lead Time Variability: Unexpected delays from your suppliers due to shipping nightmares, production hiccups, or other logistical hurdles.
The real purpose of safety stock is to decouple your customer's demand from your supplier's performance. It ensures that even if your supply chain hits a snag, your customer experience doesn't have to.
Getting a handle on how to calculate safety stock for inventory transforms your operations from reactive to strategic. It's a cornerstone of smart inventory management, allowing you to scale smoothly without the constant fear of stockouts or the cash-flow drain of over-ordering.
Proper inventory control isn't just about counting boxes; it's about planning for what's next. Nailing this number is the key to sustainable growth, ensuring you have exactly what your customers want, right when they want it.
Before you can even think about calculating safety stock, you need to get your hands on some solid, reliable data. It's a classic "garbage in, garbage out" situation. Plugging fuzzy numbers into any formula, no matter how sophisticated, will give you misleading results that could cost you thousands in lost sales or bloated carrying costs.
Think of it like gathering your ingredients before you start cooking. Get this part right, and the final dish—your perfectly balanced inventory—will be exactly what you need. The whole process boils down to collecting three core metrics for each and every product you want to analyze. These aren't just abstract numbers; they're the vital signs of your business.
First up, you need a clear picture of your average daily sales, which is often called sales velocity. This is simply how many units of a product you sell on a typical day. For anyone on Shopify, this data is right at your fingertips.
Head over to your Shopify Analytics dashboard and pull up your product sales reports. The key here is to select a relevant and stable time frame. You absolutely don't want to use data from Black Friday week or a massive clearance event, as that will completely skew your average and lead to wildly inaccurate safety stock. I've found a rolling 30- to 90-day period works well for most products. It's long enough to smooth out random daily spikes but not so long that it's influenced by outdated trends.
Pro Tip: When you're calculating this average, make sure to exclude any major stockout periods. If a product was unavailable for a full week, including those zero-sale days will artificially tank your daily average and leave you understocked down the line.
Next, you have to get a handle on your supplier lead time. This isn't just shipping time. It’s the total time, in days, from the moment you place a purchase order with your supplier until that inventory is checked in, on the shelf, and actually available for sale.
So many businesses make the mistake of only tracking the transit time. The real lead time is much more comprehensive and includes:
Start tracking this diligently from the second you send a PO. A simple spreadsheet can work wonders here, and you'll quickly see an average lead time emerge. This number is a critical piece of the safety stock puzzle. If you need a template to get started, check out our guide on creating an inventory tracking sheet.
Finally, and this is arguably the most important part, you have to account for variability. Averages are great for a baseline, but they don't tell the whole story. The real risk in inventory management lives in the unexpected swings and deviations from that average.
You need to measure variability for both your sales and your lead times. Go back to your data and find your maximum daily sales within your chosen time period, as well as your maximum lead time from your order history. These peak numbers, when compared to your averages, show you just how unpredictable your demand and supply chain really are.
This uncertainty is precisely what safety stock is designed to protect you against.
Once you have a solid handle on your sales data and lead times, it's time to translate those numbers into a real-world inventory buffer. There are several ways to calculate safety stock, and I’ll be upfront: there's no single "one-size-fits-all" formula. The best method for you depends entirely on your specific situation—how predictable your sales are, how reliable your suppliers are, and what kind of products you're moving.
We'll walk through a few of the most practical formulas, starting with the simple stuff and moving toward more statistically robust approaches. Each has its place, and knowing when to use which is the secret to a smart, cost-effective inventory strategy.
This flowchart lays out the data gathering you need to do before plugging anything into a formula. It's the foundation for everything that follows.
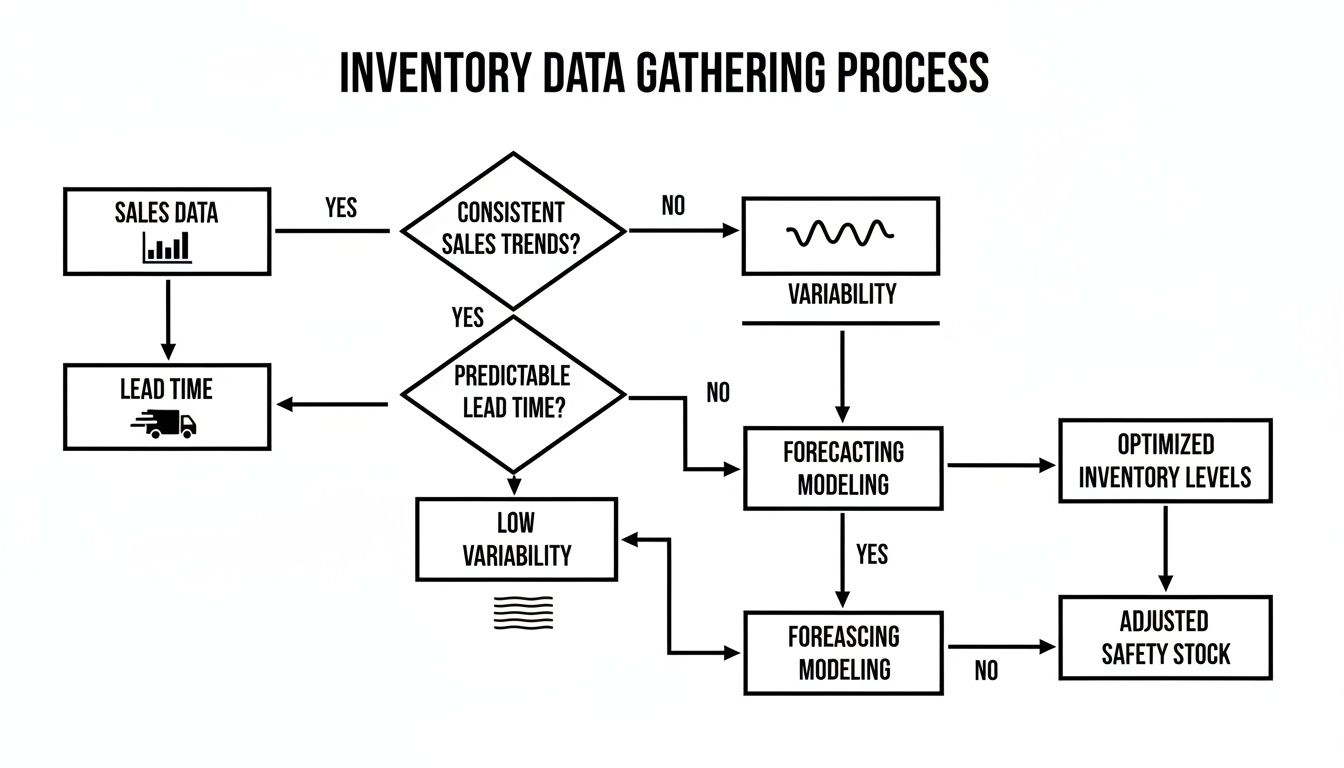
Think of this as the path from raw sales and supplier data to a clear picture of the variability you need to protect yourself against. That's the whole point of safety stock.
Imagine you're running a Shopify store in the hyper-competitive fashion niche, where a single TikTok can cause demand to spike overnight. In this world, one of the simplest yet most effective tools is the Average-Max method. It uses your historical extremes to build a buffer against nasty surprises.
This method is perfect for businesses that see huge, unpredictable swings in either demand or lead times. It’s a conservative approach, no doubt, but it prepares you for a genuine worst-case scenario by looking at the highest numbers you've ever faced.
The Average-Max Formula: Safety Stock = (Maximum Daily Sales × Maximum Lead Time) – (Average Daily Sales × Average Lead Time)
Let’s plug in some numbers from a real e-commerce scenario. Say your average daily sales for a popular t-shirt are 100 units, but during the Black Friday 2023 rush, you hit a peak of 250 units in a single day. Your typical lead time is 5 days, but during the supply chain chaos of 2022, it stretched to 10 days.
Here's the math: (250 units × 10 days) – (100 units × 5 days) = 2,500 – 500 = 2,000 units
This means you’d want to hold 2,000 extra units of that t-shirt as your safety stock. This isn't just theory; supply chain experts noted this exact method helped retailers avoid 85% of stockouts during the 2020-2021 pandemic volatility, a period when lead times globally shot up by 300% on average.
What if your supplier is a rock star who delivers like clockwork, but your customer demand is the wild card? This is a common situation for businesses selling seasonal items or products that can suddenly trend on social media. When that’s your reality, the Heizer and Render formula is a fantastic choice.
This approach isolates the variability of demand while treating lead time as a constant. It's less aggressive than the Average-Max method but much more precise when you can count on your supply chain.
Heizer and Render's Formula: Safety Stock = Z-score × Standard Deviation of Demand in Lead Time
The "Z-score" is just a statistical way of representing your desired service level—the probability that you won't stock out. A 95% service level is a common industry target, which corresponds to a Z-score of 1.65. The "Standard Deviation of Demand in Lead Time" is just a fancy term for how much your sales typically vary.
Let's pretend you sell a popular protein powder with a consistently reliable lead time of 10 days.
=STDEV.S() function on your sales data for the last 90 days. Let’s say that spits out 20 units.Std Dev of Daily Demand × √Lead Time. So, for us, it's 20 × √10 ≈ 63.2 units.You'd want to keep 104 extra units on hand. This is enough to cover most demand spikes without the hefty capital investment of the Average-Max formula, making it a much more efficient use of your cash when lead times are stable.
For many of us, both demand and lead times are moving targets. A supplier might face a shipping delay at the exact moment a product goes viral. When you have variability coming from both directions, the Normal Distribution method (sometimes called the King's Formula) is the most accurate tool in the box.
This is definitely the most statistically heavy of the formulas here, but it gives you a much more nuanced and reliable safety stock level. Why? Because it accounts for the combined risk of both demand spikes and supplier delays.
Normal Distribution Formula with Lead Time Variability: Safety Stock = Z × √((Avg Lead Time × Demand Std Dev²) + (Avg Demand² × Lead Time Std Dev²))
I know, that formula looks intimidating. But it’s just breaking down the two sources of risk—demand variability and lead time variability—and then combining them properly.
Imagine you sell a popular set of headphones. Here are your stats: * Average Daily Sales: 50 units * Standard Deviation of Daily Sales: 15 units * Average Lead Time: 14 days * Standard Deviation of Lead Time: 3 days * Desired Service Level: 95% (Z-score = 1.65)
Let's calculate the two parts inside that square root:
* Part 1 (Demand Variance): 14 days × (15 units)² = 14 × 225 = 3,150
* Part 2 (Lead Time Variance): (50 units)² × (3 days)² = 2,500 × 9 = 22,500
Now, we add them up and find the square root:
√(3,150 + 22,500) = √25,650 ≈ 160.15
Finally, multiply by your Z-score:
1.65 × 160.15 ≈ 264 units
Your safety stock should be 264 units. This number gives you a buffer that accurately protects you from both risks at the same time.
Of course, knowing how much buffer to keep is just one piece of the puzzle. That buffer directly influences when you should order more. We build on these exact concepts in our guide on how to calculate the reorder point.
Picking the right formula boils down to a simple question: what's the primary source of uncertainty in your business? Is it your customers, your suppliers, or both?
This table breaks down which method is best suited for different scenarios.
| Method | Best For | Key Inputs | Complexity |
|---|---|---|---|
| Average-Max | High volatility in both demand and lead time; when you need a simple, conservative buffer. | Max/Avg Sales, Max/Avg Lead Time | Low |
| Heizer & Render | Businesses with stable, predictable supplier lead times but fluctuating customer demand. | Z-score, Std Dev of Demand, Lead Time | Medium |
| Normal Distribution | When both demand and lead times are variable and you need the most accurate statistical calculation. | Z-score, Avg/Std Dev of Demand & Lead Time | High |
By matching your business reality to the right formula, you can stop using generic inventory rules and start building a data-driven strategy. That's how you protect your sales without tying up all your cash in the warehouse.
Once you've moved past basic inventory buffers, you can get a lot more strategic. Instead of just reacting to what happened last month, you can start proactively deciding how much risk your business is willing to take on. This is where the concept of a service level becomes your best friend.
A service level is simply the probability that you won't stock out while you're waiting for a replenishment order to arrive. Think of it as a target you set, like 90%, 95%, or even 99%. If you choose a 95% service level, you’re consciously accepting a 5% chance of stocking out. This single number is one of the most powerful levers you can pull to align your inventory costs with your customer promise.
So how do you plug a goal like "95% service level" into a formula? The magic ingredient is a statistical value called a Z-score. Don't let the name intimidate you. A Z-score is just a multiplier that tells you how much extra stock you need to hit your target probability.
You don't need to dust off a statistics textbook. For inventory planning, you just need to know the Z-scores for a few of the most common service levels.
Here’s a quick lookup table you can keep handy:
| Service Level | Acceptable Stockout Risk | Z-Score |
|---|---|---|
| 90% | 10% | 1.28 |
| 95% | 5% | 1.65 |
| 98% | 2% | 2.05 |
| 99% | 1% | 2.33 |
It's pretty clear: the higher you set your service level, the higher the Z-score. That means holding more safety stock to create a bigger cushion. This direct link is what allows you to really dial in your inventory strategy.
Choosing a service level isn't just a math problem—it’s a business decision. The real question is: what does a stockout actually cost you? For a high-margin, hero product, a lost sale can be incredibly damaging. For a low-margin item that a customer can easily buy elsewhere, the cost is much lower.
Picture this: you run a Shopify store that specializes in high-end drones. Your top-seller is a $999 model with a great profit margin. A stockout here is a complete disaster. You don't just lose the revenue from that one sale; you risk losing a high-value customer to a competitor for good.
For a product like this, aiming for a 98% or 99% service level makes perfect sense. You're making a strategic choice to invest more in inventory to protect your revenue and brand reputation. On the flip side, for a generic $15 phone case with dozens of lookalikes on the market, a 90% service level might be totally fine. The cash you save by holding less stock could be put to much better use.
Your service level is a direct reflection of your customer promise. A premium brand promising immediate availability needs to back that up with a high service level and the inventory investment that comes with it.
For D2C brands, especially in fast-moving industries like health and wellness, demand can feel completely unpredictable thanks to viral social media trends. This is where a more advanced formula shines, as it directly accounts for your chosen service level and the real-world chaos of demand and lead time variability.
The formula looks like this: Safety Stock = Z × √(Avg Lead Time × Demand Std Dev² + Avg Demand² × Lead Time Std Dev²).
Let's break it down with an example. Say you're targeting a 95% service level, which gives you a Z-score of 1.65. Your average daily demand is 500 units (with a standard deviation of 50), and your average lead time is 4 days (with a standard deviation of 1).
First, you calculate the combined variability: √(4 × 50² + 500² × 1²) which comes out to about 509.9.
Then, you multiply that by your Z-score: 509.9 × 1.65 = 841 units. That's your safety stock. This exact approach helped US retailers slash stockouts by 40% after the supply chain mess of 2022 because it's built to handle both unexpected demand spikes and supplier delays. For a deeper dive, check out these expert insights on statistical safety stock methods.
By setting intentional service levels for different products, you graduate from a one-size-fits-all approach to a sophisticated, segmented inventory strategy. It's how you ensure your cash is working hardest right where it matters most.
Getting a handle on these formulas is a massive win for any Shopify store, but let's be real—spreadsheets have a ceiling. They're fundamentally static. A Google Sheet won't flag a sudden delay from your supplier or notice a new sales trend bubbling up on TikTok until you manually punch in the numbers.
The market moves every second, but your spreadsheet only gets updated when you can carve out a few hours to do it. That gap between what's happening right now and what your static calculations show is exactly where stockouts are born and cash gets tied up in dust-collecting overstock. For any growing brand, manually crunching safety stock for every single SKU isn't just a headache; it's a competitive handicap.
The reality of e-commerce is chaos. Customer tastes change, supply chains get tangled, and a single marketing campaign can trigger an avalanche of orders. A spreadsheet just can’t keep pace.
Imagine you're selling consumer electronics with unpredictable lead times from your suppliers in Asia. The service level-based formula is perfect for this: Safety Stock = Z-score × Std Dev of Demand × √Lead Time. It’s built for situations where demand is pretty steady but lead times are all over the map—a classic e-commerce problem. In 2024, average lead times of 12-15 days are already up 20% from 2019.
This isn’t a small issue. Some studies show a staggering 70% of stockouts happen because of this lead time volatility, costing online businesses an estimated $500 billion a year. You can dig deeper into these safety stock formulas and their impact if you want the full picture.
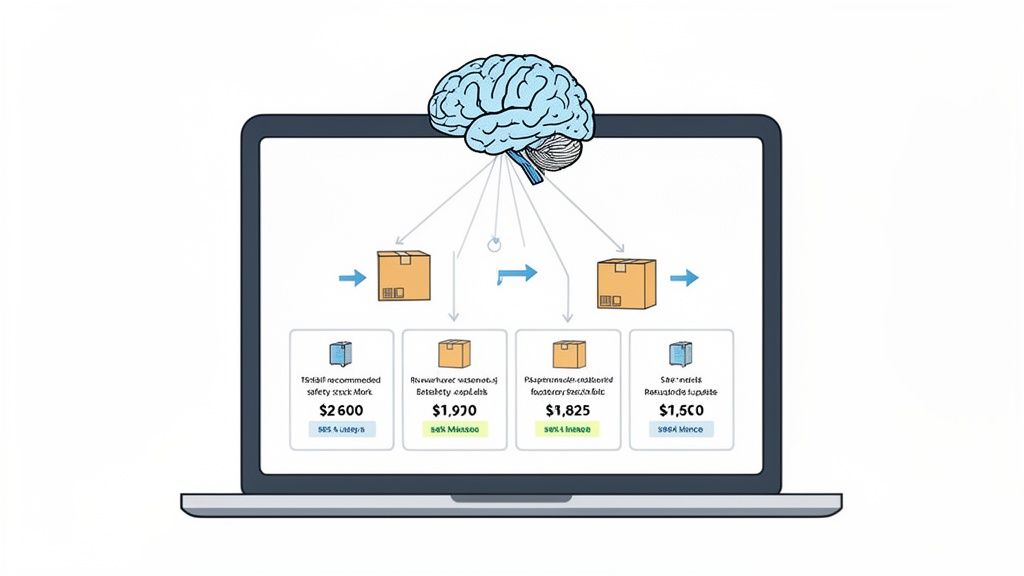
While you can do the math yourself, the inputs—especially the standard deviation of lead time—are a constantly moving target. This is where AI-driven tools completely change the game.
Platforms like Tociny.ai were built to solve this exact problem for Shopify merchants. Instead of you having to export data and wrestle with formulas, an AI system automates the whole thing. It hooks directly into your Shopify store and continuously sifts through your real-time sales data.
Here’s how it handles the tricky variables we’ve been talking about:
Instead of you having to run the formulas, an AI-powered tool runs them continuously for you. It turns the complex task of how to calculate safety stock for inventory into an automated background process that supports your growth.
The result is a dynamic safety stock level that flexes with your business in real time. When a product starts trending, the system proactively tells you to increase its buffer. If a supplier's shipments start slipping, your safety stock is adjusted to compensate.
This breaks you free from the endless cycle of data entry and spreadsheet maintenance. You can finally stop spending your time in the spreadsheet and start using the insights to make smart decisions—like negotiating better terms with suppliers, planning your next big promotion, or finding your next winning product. You get all the precision of statistical inventory control without needing a Ph.D. in statistics to pull it off.
Even with the perfect formulas, reality hits when you start calculating safety stock. Theory is one thing, but applying it to your own business always brings up a few questions. Let's walk through some of the most common ones I hear from store owners.
When you're just starting out, you're flying a bit blind. You don't have years of sales data to lean on.
A great starting point is a service level between 90-95%. This is the sweet spot. It gives you a respectable cushion against stockouts, protecting your brand reputation and keeping new customers happy, but it won't force you to sink all your precious startup cash into inventory.
Think of it as a balanced approach. Once you've got a few months of sales under your belt, you can start getting more strategic. For your high-margin, can't-keep-it-in-stock bestsellers, you might push that up to 98% to make sure you never miss a sale.
Safety stock is not a "set it and forget it" number. Your suppliers, your customers, and the market itself are all moving targets. Your inventory buffer needs to move with them.
Here’s a good rule of thumb:
This is exactly why so many businesses turn to automation. Instead of spending hours in a spreadsheet every month, an AI-powered platform can adjust your safety stock levels in near real-time, responding instantly to new data.
Can You Have Too Much Safety Stock? Yes, and it's a dangerous trap to fall into. Overstocking is a silent cash flow killer. It means higher carrying costs, more capital tied up on shelves, and a much bigger risk of inventory becoming obsolete or expiring. The goal isn't maximum safety stock; it's optimized safety stock.
This is a critical point: standard safety stock formulas don't inherently understand seasonality. They are only as smart as the data you feed them.
When you're doing this manually, the responsibility falls on you. To plan for your Black Friday rush, you need to calculate your average sales and demand deviation using last year's holiday data, not numbers from a slow July. Garbage in, garbage out.
This is another huge advantage of modern forecasting tools. AI is specifically designed to identify these patterns automatically. It can see the annual holiday spike or the summer slump in your data and adjust its calculations accordingly, removing the potential for human error.
Ready to stop wrestling with spreadsheets and get precise, automated safety stock recommendations? Tociny.ai connects to your Shopify store to analyze sales trends and supplier performance, giving you dynamic inventory levels for every SKU. Get early access to Tociny.ai and start optimizing your inventory today.
Tociny is in private beta — we’re onboarding a few select stores right now.
Book a short call to get early access and exclusive insights.