Methods of forecasting demand fall into two main categories: qualitative, which relies on expert opinions and market insights, and quantitative, which uses historical sales data to project future outcomes. Successful e-commerce brands often use a blend of these approaches to create a more accurate and resilient inventory strategy.
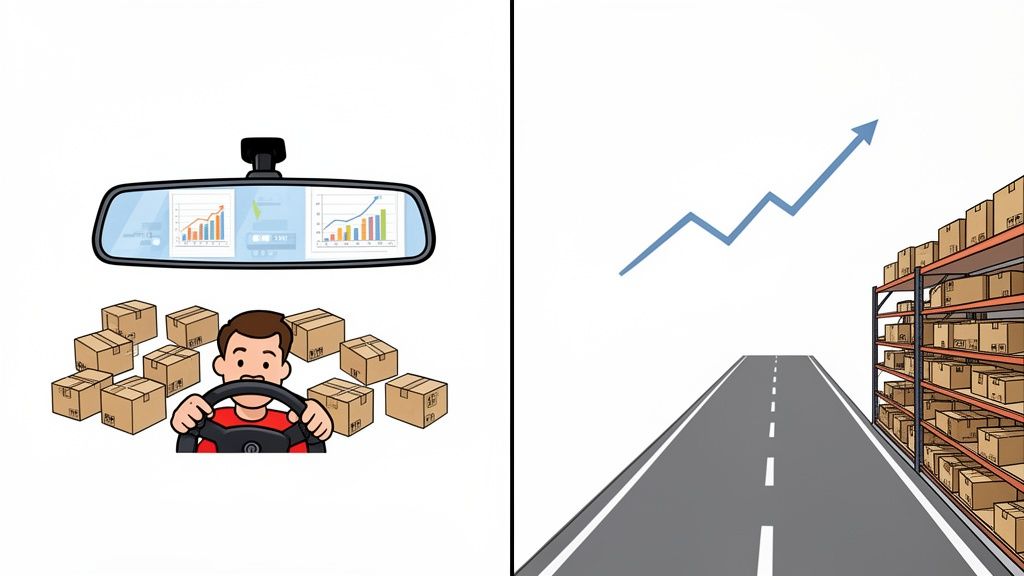
Running an e-commerce store without a solid forecast is like driving a race car while only looking in the rearview mirror. Sure, you can see where you’ve been—your past sales, your previous wins—but you have zero visibility on the sharp turns up ahead. Those turns could be a sudden spike in demand, an unexpected market shift, or a competitor's surprise promotion.
This reactive approach isn't just risky; it's expensive. The costs of poor planning pile up fast. Overstocking ties up precious cash in products that are just sitting on a shelf, racking up storage fees until you’re forced into a costly clearance sale. On the flip side, understocking leads to stockouts that frustrate shoppers, damage your brand's reputation, and send would-be customers straight to your competition.
It's a common problem. Research shows that only 43% of sales leaders feel they can forecast with high accuracy, leaving the majority vulnerable to these completely avoidable financial hits.
Demand forecasting is what pulls you out of the guessing game and into a strategic position. It’s the process of using predictive analysis to make an educated estimate of how much customers will want to buy in the future. This isn't about gazing into a crystal ball; it's about making smarter, data-informed decisions that directly grow your bottom line.
By implementing effective methods of forecasting demand, you gain several game-changing advantages:
The core purpose of forecasting is to turn unknowns into opportunities. By anticipating future needs, you empower your business to navigate market volatility with confidence, ensuring you are always one step ahead.
Ultimately, every forecasting technique tries to answer one simple question: "How much of a product will customers buy down the road?" The methods you choose will vary, but they generally fall into a few key camps. You’ll find qualitative approaches based on human judgment, quantitative models that crunch historical data, and modern AI-driven systems that combine the best of both worlds.
This guide will walk you through each one, helping you transition from reactive ordering to proactive, strategic planning.
Every demand forecasting method boils down to one of two schools of thought: qualitative or quantitative.
Think of it like trying to predict a new restaurant's success. A qualitative approach is like asking a seasoned chef for their gut feeling. They’d consider the menu, the head chef's reputation, and the location—it’s an educated guess rooted in experience and intuition.
A quantitative approach, on the other hand, is like digging into a similar restaurant's historical sales data to predict how many burgers they'll sell next Friday. This method is all about the hard numbers and past performance, making it the bedrock for managing products you already sell. The right approach always depends on the kind of data you have to work with.
Qualitative forecasting leans on subjective inputs—things like expert opinions, customer surveys, and good old-fashioned market research. It really shines when historical sales data is either completely missing or just not relevant anymore, a common challenge for e-commerce brands breaking new ground.
You'll find yourself reaching for qualitative methods when you’re: * Launching a new product. With zero sales history, you have to rely on market research, focus groups, and analysis of similar products to get a ballpark estimate of initial demand. * Entering a new market. Customer behavior in a new country or region is a total unknown. Local expert knowledge becomes far more valuable than your historical sales data from back home. * Dealing with major market disruptions. When something unprecedented happens (like a pandemic or a sudden supply chain crisis), past data loses its predictive power. You're forced to rely on expert judgment to navigate the fog.
One of the most trusted qualitative techniques is the Delphi method. This involves putting together a panel of experts and anonymously collecting their forecasts over several rounds. After each round, a facilitator shares the combined, anonymous results, letting the experts tweak their predictions until a consensus starts to form. It’s a smart, structured way to filter out individual biases and arrive at a more balanced forecast.
While qualitative methods help you map out the unknown, quantitative forecasting is the engine that powers your day-to-day inventory management. For any product with an established sales history, these methods of forecasting demand use mathematical models to comb through past data, spot patterns like trends and seasonality, and project future sales.
Quantitative forecasting operates on a simple principle: the past holds clues about the future. It’s the perfect tool for: * Managing your core products. For bestsellers with months or even years of sales data, quantitative models deliver reliable, data-driven predictions you can count on. * Pinpointing seasonal trends. These models can accurately predict the surge in swimwear sales in summer or the spike in gift sets during the holiday rush. * Fine-tuning your stock levels. By forecasting demand with high precision, you can maintain leaner inventory, slash carrying costs, and drastically reduce the risk of stockouts.
The core difference is simple: Qualitative forecasting asks, "What do the experts think will happen?" while quantitative forecasting asks, "What does the data say will happen?" The smartest businesses know they need to ask both.
So, when do you trust the art, and when do you lean on the science? Understanding the key differences is crucial for picking the right tool for the job. A Shopify merchant wouldn't use the same method for a brand-new, experimental product launch as they would for their all-time flagship item.
This table breaks down the core distinctions:
| Attribute | Qualitative Methods (The 'Art') | Quantitative Methods (The 'Science') |
|---|---|---|
| Data Source | Expert opinions, market surveys, intuition | Historical sales data, statistical models |
| Objectivity | Subjective, based on human judgment | Objective, based on mathematical calculations |
| Best Use Case | New products, new markets, long-term planning | Established products, stable markets, short-term planning |
| Time Horizon | Often used for long-range strategic forecasts | Most accurate for short to medium-term forecasts |
| Key Weakness | Can be influenced by personal bias and optimism | Relies on past data, struggles with sudden market shifts |
Ultimately, neither approach is universally "better." The most effective forecasting strategies often blend the two, using quantitative models for stable products and layering on qualitative insights to account for new launches, promotions, or unexpected market changes.
While qualitative methods are built on expertise and intuition, quantitative forecasting is all about the numbers. This is where we let historical data do the talking, using mathematical models to sift through past sales, spot hidden patterns, and project what’s coming next. Think of it as the engine powering inventory planning for your established, core products.
This approach really shines when you have a solid history of sales data to work with. By digging into that history, you can uncover the natural rhythm of your business—the weekly cycles, the seasonal spikes, and the long-term growth trends that tell your product's story.
For e-commerce, quantitative forecasting generally breaks down into two camps: Time Series Analysis and Causal Models. Each one tackles the question of future demand from a slightly different angle.
Time series analysis is the most straightforward way to predict the future by looking directly at the past. Imagine your sales data is a song with a distinct beat. This method helps you find that beat—the recurring patterns and rhythms—so you can anticipate the next note.
The core idea is simple: patterns we’ve seen before are likely to happen again. This makes it an incredibly powerful tool for products with a stable sales history. In fact, it's become a cornerstone of modern demand planning. Research shows that businesses using these data-driven techniques grow 19% faster than competitors who rely on manual guesswork alone. That’s a massive advantage. You can learn more about how historical data sharpens forecasting on Forthcast.io.
Two of the most practical time series techniques for Shopify merchants are:
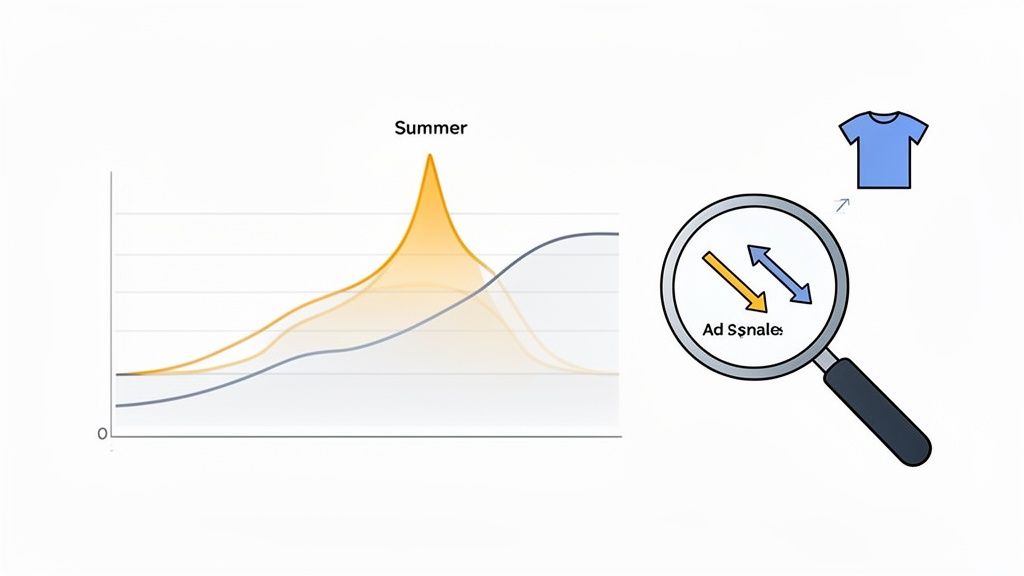
Example in Action: A Shopify store selling T-shirts notices a huge sales spike every June and July. By plugging the last two years of summer sales into a time series model, they can see this seasonal pattern clearly. The model predicts a similar spike for the upcoming summer, giving the owner the confidence to order the right amount of inventory well ahead of time.
If time series analysis is about the "what" and "when" of your sales, causal models are all about the "why." This approach acts like a detective, searching for the cause-and-effect relationships between your sales and other specific factors.
Instead of just looking at past sales in a vacuum, causal models connect sales volume to internal decisions and external events. This is where forecasting gets really interesting, because you can start to see exactly how your own actions move the needle.
The go-to technique here is regression analysis. This statistical method measures the relationship between a dependent variable (your sales) and one or more independent variables that you control or observe.
Common variables you might look at include: * Marketing Spend: How much does a $1,000 bump in ad spend impact sales of a particular product? * Promotions and Discounts: What's the predictable sales lift you get from a 20% off weekend sale? * Competitor Pricing: Did your sales dip right after a major competitor launched a similar product at a lower price? * Website Traffic: Is there a direct link between the number of daily visitors and the number of orders you receive?
Example in Action: An electronics store owner runs a regression analysis and finds that for every $500 spent on Google Ads for their top-selling headphones, they generate an extra $2,500 in sales. Now, they can invest in ad campaigns knowing the likely return, turning their marketing budget into a predictable sales driver.
By understanding these relationships, you build a model that predicts sales based on what you plan to do. It transforms forecasting from a passive look at the past into an active tool for strategic planning. You can use it to decide how much to spend on a holiday campaign or to anticipate the fallout from a price increase, giving you much more control over your business's future.
If traditional forecasting methods are like using a paper map, then AI and machine learning are your live GPS. A map gives you a static route based on yesterday's information. A GPS, on the other hand, reroutes you in real-time based on live traffic, accidents, and weather. That's the leap AI brings to demand forecasting.
While time-series and causal models are powerful in their own right, they mostly look backward at your own history. AI models look everywhere, all at once. They're built to consume massive, complex datasets that go far beyond your sales history, painting a much richer, more dynamic picture of the market.
This allows AI to spot subtle, non-linear patterns that are completely invisible to both the human eye and conventional statistical models. It connects the dots between seemingly unrelated events to produce a forecast that’s far more accurate and alive to the moment.
The real magic of AI is its ability to analyze a huge array of external and internal signals at the same time. Think of it as a super-analyst that never sleeps, constantly scanning for anything that could influence your customers.
An AI model can pull in variables like:
By processing all this information together, AI models build a holistic view of the market. This lets them anticipate shifts in demand before they happen, giving you a critical head start.
An AI-driven forecast doesn't just predict what will sell; it starts to understand why it will sell. This transition from reactive to predictive planning is what gives modern e-commerce brands their competitive edge.
Not too long ago, this level of analysis was reserved for massive corporations with their own data science teams. Today, platforms like Tociny.ai are making this power accessible to Shopify store owners, no data science degree required.
These tools automate the entire complex process. They plug directly into your Shopify data, pull in relevant market signals, and run sophisticated machine learning algorithms behind the scenes. The result? A clear, actionable forecast delivered through a simple dashboard. Instead of spending hours buried in spreadsheets, you get precise inventory recommendations with just a few clicks.
For a deeper look into this technology, check out our guide on how AI-powered tools assist with demand forecasting in our guide.
Adopting AI isn't just about chasing a slightly more accurate number. It fundamentally changes how you run your business, delivering concrete advantages that show up on your bottom line.
Key Benefits of an AI-Powered Approach
To stay competitive, it’s vital to understand how these technologies are reshaping ecommerce. To learn more, explore this article on the rise of AI in ecommerce. This shift toward intelligent automation isn't some far-off concept anymore—it's the new standard for running a lean, profitable retail operation.
Picking the right forecasting method isn't about finding one "best" option. It's about building a flexible toolkit that matches the unique rhythm of your business. Moving from theory to practice means asking the right questions.
Are you launching a brand-new product with zero sales history, or are you managing a bestseller that's been on the market for years? Do you have two years of clean sales data or just a few volatile months? Is your market stable, or is it constantly shifting with new trends? The answers will point you toward the most effective approach, ensuring you’re not using a hammer when you really need a screwdriver.
Your most fundamental starting point is your data. This simple factor often decides whether you lean on the art of qualitative insights or the science of quantitative models.
This decision tree shows that first, critical fork in the road.
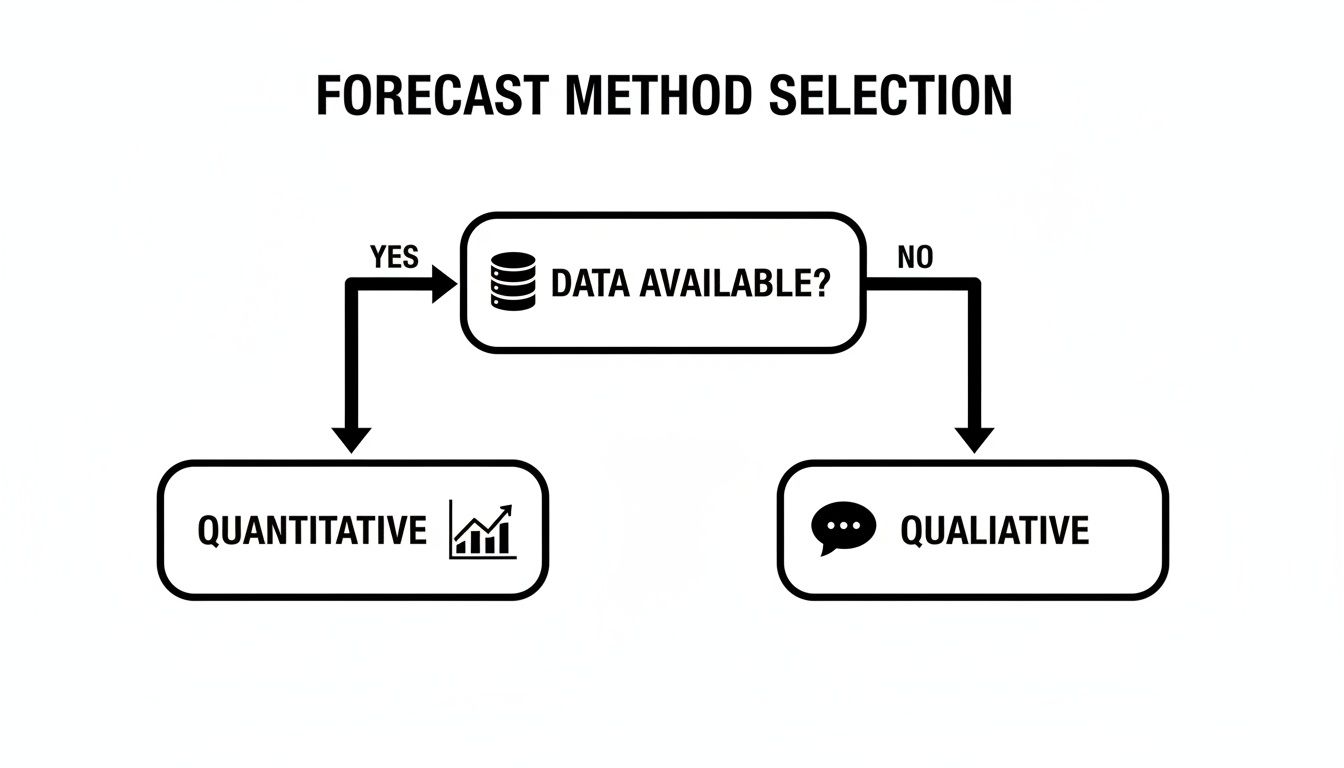
As you can see, the presence or absence of historical sales data is the primary driver. It guides you toward either data-driven quantitative analysis or judgment-based qualitative techniques.
Your product's stage of life is a huge factor in choosing the right forecasting method. A product just hitting the market has completely different needs than a mature, steady seller.
When picking your approach, it's smart to explore various inventory forecasting methods to see the bigger picture. This helps ensure your demand plan aligns perfectly with your inventory strategy.
The smartest brands rarely stick to just one method. They know a single approach is a fragile strategy. Instead, they build a more resilient and accurate forecast by creating a hybrid model—a blend of qualitative and quantitative techniques.
Think of it this way: you can run a highly accurate quantitative model on your core, year-round products while using qualitative insights for an upcoming seasonal collection. Your data-driven forecast for last year's winter coats provides a solid baseline, which you can then adjust based on this year's new fashion trends and expert opinions.
A hybrid approach creates a system of checks and balances. The data grounds your intuition, while your market knowledge helps you see beyond the numbers and anticipate changes the historical data can’t predict.
This integrated strategy is essential for achieving robust accuracy. Evidence shows that companies using multiple forecasting methods achieve 20-50% error reductions compared to single-method approaches. Some retailers even report 20% improvements in forecast accuracy and 15% reductions in stockouts just by using integrated models.
As you build out your forecasting process, keep these three critical factors in mind. They will help you fine-tune your approach for each product and situation.
Ultimately, the best approach for your store will evolve as your business grows. The key is to remain flexible, continuously measure your accuracy, and choose the right tool for the right job. For businesses looking to automate and refine this process, exploring various demand forecasting software can provide a significant advantage.
Even after you get the hang of the different methods of forecasting demand, a few practical questions always pop up when it's time to actually do the work. Getting started can feel like a huge task, but the secret is breaking it down into smaller, manageable pieces.
This section tackles the most common questions we hear from Shopify merchants, with answers designed to help you move from theory to confident action.
This is probably the number one question we get, and the good news is, the answer is flexible. It really boils down to the forecasting method you choose and what you’re trying to accomplish.
The most important takeaway? Just start with what you have. Even a small dataset is a far better foundation than intuition alone.
You can't improve what you don't measure. Keeping a close eye on your forecast's performance is the only way to get better over time. While there are tons of metrics out there, you only need one or two to get started.
For most e-commerce brands, these two are the most useful:
A great starting point is to consistently track MAPE for your key products. A lower score is always better, and benchmarking this number will show you exactly how your forecasting improvements are paying off.
Want to dive deeper into these metrics and learn how to shrink your error rate? Check out our detailed guide on achieving better demand forecast accuracy.
Absolutely—when you're just starting out. Spreadsheets are a fantastic playground for learning the fundamentals. You can calculate a simple moving average, track your MAPE, and get a real, hands-on feel for how the numbers work without spending a dime.
But as your business grows, that trusty spreadsheet quickly turns into a liability. It’s manual, incredibly time-consuming, and dangerously prone to human error. One bad formula can derail your entire inventory plan for months.
The second you want to factor in multiple variables—like promotions, ad spend, and seasonality—spreadsheets just can't keep up. That’s the tipping point where dedicated, AI-driven tools become essential. They automate the heavy lifting to deliver faster, more accurate forecasts with a fraction of the effort.
There isn't a single magic number here; the right rhythm depends entirely on your products and how fast your market moves. The goal is to find a consistent cadence that works for you.
The real key is consistency. Set a schedule to review your forecast against actual sales, tweak your assumptions, and rerun the numbers. This simple habit transforms forecasting from a one-off chore into a strategic process that gets smarter and more accurate over time.
Ready to move beyond spreadsheets and guesswork? Tociny.ai offers an AI-powered inventory analytics platform that generates precise, actionable demand forecasts for your Shopify store. Stop reacting and start planning with confidence. Get early access to Tociny.ai today.
Tociny is in private beta — we’re onboarding a few select stores right now.
Book a short call to get early access and exclusive insights.