
Ever had that heart-sinking, yet thrilling, feeling when a product blows up on TikTok and you sell out in a matter of hours? That’s a classic safety stock problem. In a nutshell, safety stock is the extra cushion of inventory you keep on hand to shield your business from those wild demand spikes and frustrating supply chain delays.
Safety stock isn't just some boring inventory term—it's your business's insurance policy. For Shopify merchants, getting this calculation wrong means leaving money on the table and disappointing customers who showed up ready to buy. Simply guessing or relying on a generic "two weeks of supply" rule is a recipe for disaster. You either tie up precious cash in unsold products or, worse, lose sales to stockouts.
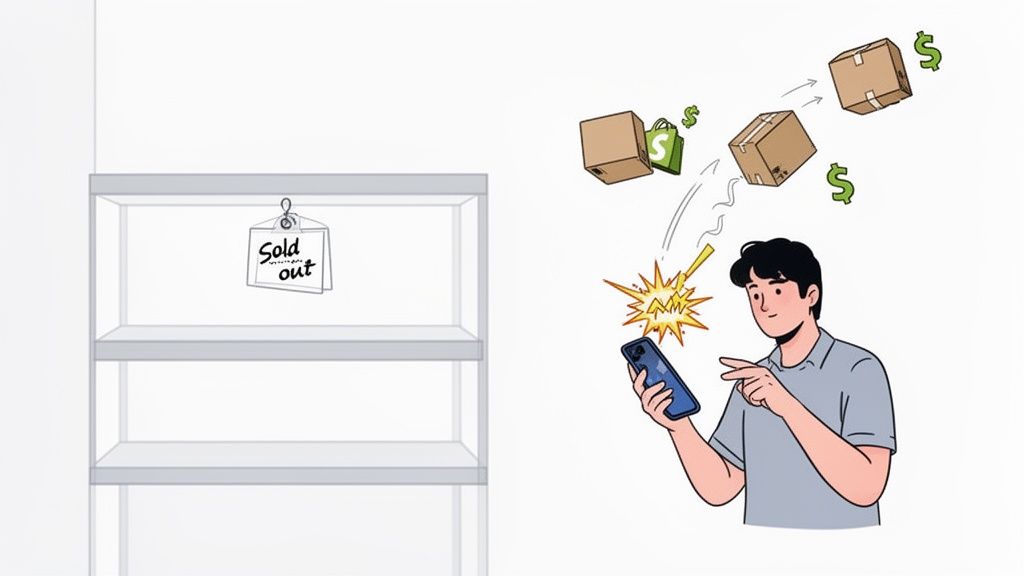
The most obvious hit from understocking is lost sales. When a potential customer lands on a product page only to see "Sold Out," they don't wait around. They click away, often heading straight to a competitor.
In fact, research shows that stockouts can slash annual sales by as much as 4%—a significant blow for any growing brand. But it doesn't stop there. Stockouts also damage your brand's reputation and can even hurt your search engine rankings, as algorithms tend to demote out-of-stock product pages.
The true cost of a stockout is not just the single sale you lose today. It's the future loyalty, the repeat purchases, and the positive word-of-mouth that vanish along with it.
On the flip side, having too much inventory quietly drains your resources. Every dollar tied up in products collecting dust on a shelf is a dollar you can't invest in marketing, new product development, or other growth initiatives.
This excess stock also racks up carrying costs—think warehousing fees, insurance, and the ever-present risk of damage or obsolescence. This is especially painful for products with short lifecycles, like seasonal fashion or perishable wellness items.
A smart, calculated approach is the only way to find that profitable sweet spot. To help illustrate, here’s a quick breakdown of what’s at stake:
| Metric | Poor Safety Stock Management | Optimized Safety Stock Management |
|---|---|---|
| Sales | Lost revenue due to frequent stockouts. | Maximized sales by ensuring product availability. |
| Customer Loyalty | Damaged reputation and frustrated customers. | Increased customer satisfaction and repeat business. |
| Cash Flow | Capital tied up in excess, unsold inventory. | Improved cash flow with lean, efficient stock levels. |
| Carrying Costs | High fees for warehousing, insurance, and obsolescence. | Minimized holding costs, freeing up capital. |
| Operational Efficiency | Reactive scrambling and expensive rush orders. | Proactive, stable operations with predictable fulfillment. |
As you can see, the difference is stark.
By avoiding stockouts and overstocking with proper safety stock calculations, you can directly increase retail sales and protect your bottom line. It’s how you transform inventory from a necessary cost into a powerful, strategic lever for growth.
When you're first getting a handle on safety stock, it's best to start with a straightforward method, especially for products with relatively predictable sales. If you have core items that sell consistently, you don't need a super complex statistical model to get a reliable buffer. This is where the Average-Max formula really shines.
The whole point of this approach is to shield your business from a worst-case scenario. It does this by looking at the highest possible demand during the longest possible lead time. It creates a solid buffer without you needing a degree in statistics, making it a perfectly practical first step for most businesses.
The calculation itself is simpler than it sounds. You just need to pull four key pieces of data from your sales history and supplier communications:
Once you have these numbers, you just plug them into the formula. The Average-Max method has been a staple in inventory management for a good reason; its logic is built on preparing for that perfect storm of high demand and supplier delays.
The Formula: Safety Stock = (Maximum Lead Time × Maximum Daily Sales) – (Average Lead Time × Average Daily Sales)
Let's say your max sales hit 120 units on a busy day, and your max lead time is 10 days. If your average sales are 100 units and your average lead time is 7 days, your math looks like this: (10 × 120) – (7 × 100) = 500 units.
This isn't just theory. Research shows this direct approach can slash stockouts by up to 30% in fast-moving industries like fashion and electronics.
Let's put this into practice. Imagine you run a Shopify fashion brand, and you have a popular line of sustainable t-shirts. As you head into the busy summer season, you absolutely cannot afford to run out of this bestseller.
You dive into your data from last year's peak season:
Now, let's calculate it:
Calculation: (25 days × 80 units/day) – (15 days × 50 units/day) 2000 – 750 = 1250 units
Based on this, you should hold 1,250 t-shirts as your safety buffer to protect against both a surge in demand and unexpected shipping delays.
Of course, a crucial part of this calculation is having reliable sales data. You can't just guess these numbers. Solid demand forecasting is essential to forecast demand accurately and get this right. This foundational formula gives you a tangible, data-backed figure to work with, turning abstract risk into a concrete inventory plan.
When you're dealing with products that have wild, unpredictable demand, the basic Average-Max formula just won't cut it. It can leave you dangerously exposed to stockouts. For these more volatile SKUs, you need a smarter approach. This is where the statistical safety stock formula becomes your best friend.
This method moves beyond simple "worst-case scenario" thinking and uses actual sales data to build a more responsive inventory buffer. It hinges on a few key statistical concepts that, once you get the hang of them, give you precise control over your stock levels.
At its core, the formula is: Safety Stock = Z-score × Standard Deviation of Demand × √Average Lead Time.
It might look a little intimidating at first, but each piece of that puzzle plays a clear and logical role in protecting your business from the unexpected.
This visual breaks down the basic flow for putting this formula to work.
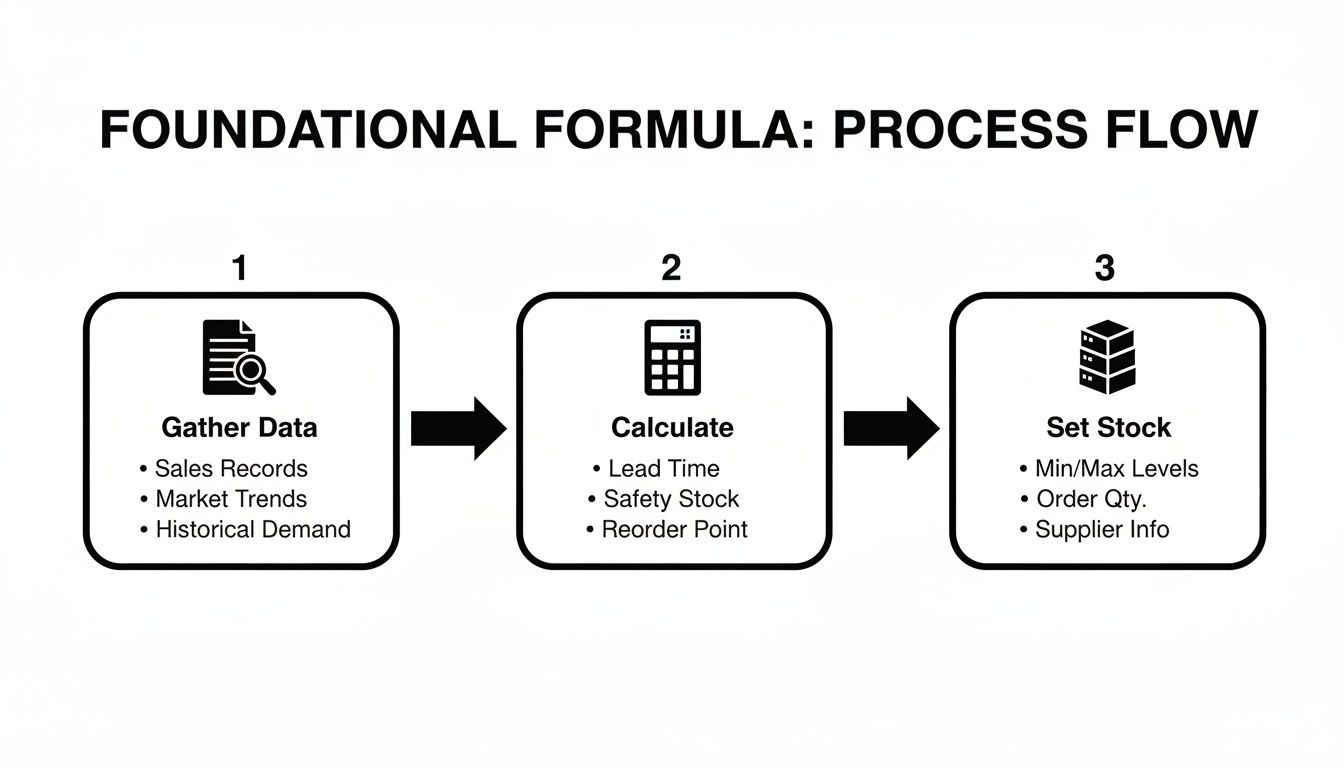
The process is straightforward: gather your historical data, run the numbers, and then you can confidently set your final stock levels.
To really nail this formula, you first have to understand its components. I promise they're more intuitive than they sound.
Z-score: Think of this as a statistical dial for your desired service level—in other words, the probability you won't run out of stock. A higher Z-score means you want a higher in-stock rate, which naturally requires more safety stock. For instance, a Z-score of 1.65 translates to a 95% service level, meaning you're comfortable with a 5% chance of stocking out.
Standard Deviation of Demand: This is just a fancy way of measuring how much your daily sales tend to bounce around the average. A high standard deviation means sales are erratic and all over the place, while a low one points to stable, consistent demand. For a deeper dive, check out our guide on improving demand forecast accuracy.
Average Lead Time: This is the typical time, in days, it takes from placing an order with your supplier to receiving the goods. We use the square root of this number to correctly factor its impact on your overall risk.
Choosing your service level is a strategic business decision. A 99% service level sounds amazing, but the extra inventory cost might be overkill for a slow-moving, low-margin item. You have to balance the cost of holding that extra stock against the cost of a lost sale for each product.
To make this easier, here's a quick reference table that connects common service level goals with the Z-score you'll need for your calculation. This is a great starting point for figuring out what's right for your different products.
| Desired Service Level | Z-Score |
|---|---|
| 85% | 1.04 |
| 90% | 1.28 |
| 95% | 1.65 |
| 97% | 1.88 |
| 98% | 2.05 |
| 99% | 2.33 |
Remember, a higher service level means carrying more inventory, so choose a target that aligns with each SKU's importance to your bottom line.
Let's walk through a real-world example. Imagine you run a health and wellness brand, and your new line of protein bars has pretty choppy weekly sales. You want to maintain a 95% service level to keep your loyal customers happy and avoid backorders.
Here’s the data you’ve pulled from your sales records:
Now, we just plug these numbers into the formula:
Calculation: Safety Stock = 1.65 (Z-score) × 20 (Std Dev) × √9 (Lead Time) Safety Stock = 1.65 × 20 × 3 Safety Stock = 99 bars
The result? You should aim to keep an extra 99 protein bars on hand as your safety buffer. This isn't just a guess; it's a data-driven number tailored specifically to this product's volatility and your business goals, giving you far more precision than a generic rule of thumb ever could.
Let's be honest: not all of your products are created equal.
That bestselling hoodie driving a massive chunk of your revenue deserves a different safety stock strategy than a slow-moving, niche accessory. Applying one single, blanket formula across your entire catalog is a classic mistake. It's how you end up with cash tied up in all the wrong places.
This is exactly where ABC analysis can change the game.
It's a powerful way to segment your inventory, helping you classify products based on their actual value to your business. The whole thing is built on the Pareto principle, which in ecommerce often means about 80% of your revenue flows from just 20% of your products. By sorting your SKUs into buckets, you can put your inventory budget to work where it'll deliver the biggest bang for your buck.
The process is pretty straightforward. You rank your products by their annual revenue contribution and then split them into three distinct categories. This allows you to set different inventory policies—including safety stock levels and service level targets—for each group.
A-Items: These are your superstars. They’re the top 10-20% of your SKUs that bring in the lion's share of your revenue, usually around 70-80%. A stockout on an A-item is painful and expensive, so these products demand the highest service levels and the most carefully managed safety stock.
B-Items: Think of these as your steady, middle-of-the-road performers. They typically make up the next 20-30% of your product catalog and chip in about 15-25% of your revenue. They’re important, for sure, but a stockout here isn't quite as catastrophic as it is with an A-item.
C-Items: This is your long tail. C-items account for the vast majority of your SKUs (often 50-60% of them) but only contribute a tiny fraction of your revenue, maybe 5-10%. Overstocking these items is a massive drain on capital, so they get the lowest service level targets and the leanest safety stock.
If you want a deeper dive into the methodology, check out our complete guide on how to perform an ABC-XYZ analysis for your Shopify store.
A-items are your non-negotiables. You have to protect them at all costs. C-items, on the other hand, are where you can afford to run lean. It's often perfectly fine to stock out of a C-item now and then if it means freeing up cash to keep your A-items always available.
Once you have your inventory segmented, the next move is to assign a specific service level target to each category. This number directly feeds into the Z-score you'll use in your statistical safety stock formula, making sure your most valuable products get the protection they truly deserve.
This isn't just theory; this strategic approach gets real results. We've seen brands set service levels of 95-98% for A-items, dial it back to 85-95% for B-items, and go with a more conservative 80-85% for C-items.
What happens next? It’s not uncommon to see fill rates jump by 15% while the total value of inventory drops by 12%. For direct-to-consumer food and beverage brands, where C-items can make up 70% of the catalog, this technique can slash overstock by 20-30%. You can read more about these kinds of results over on Netstock's inventory blog.
By segmenting your inventory, you’re moving from a reactive, one-size-fits-all approach to a proactive, strategic one. It ensures every dollar tied up in safety stock is working as hard as possible to protect your sales and beef up your bottom line.
Let’s be honest. While the formulas are great, manually calculating safety stock in a spreadsheet for every single SKU is a soul-crushing time sink. As your Shopify store grows and your product catalog expands, that spreadsheet just doesn't scale. It quickly becomes an error-prone, operational bottleneck.
This is exactly where manual methods hit a wall and modern automation takes over. Instead of losing hours buried in Excel, you can use tools built to do the heavy lifting for you. This is how you shift from simply reacting to inventory problems to proactively managing them—freeing up cash flow and keeping customers happy in the process.
Platforms like Tociny.ai are designed to take the guesswork out of the equation. By connecting directly to your sales data, they use adaptive forecasting to analyze historical performance, spot emerging trends, and automatically recommend precise safety stock levels for each product.
What you get is a dynamic, data-driven buffer that adjusts as market conditions change. You never have to touch a complex formula again.
Manual calculations are static; they're a snapshot in time. Automated systems are alive. They constantly learn from your sales data to refine recommendations, ensuring your safety stock is always optimized for current demand and supply conditions.
This is what it looks like in practice. The Tociny.ai dashboard presents these insights in a clean, actionable format.
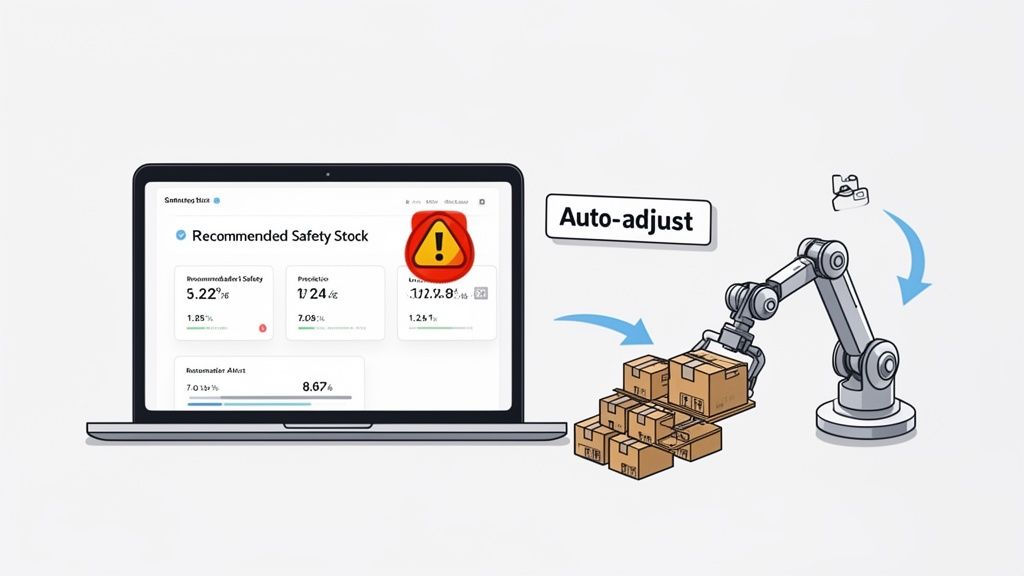
You can see at a glance which products are overstocked, which are at risk of selling out, and what your projected sales look like. It’s all there, letting you make quick, confident decisions.
The real magic of automation isn't just the number-crunching; it’s the proactive management it unlocks. Instead of finding out about a stockout after it has already cost you sales, you get predictive alerts warning you when a product’s inventory is projected to run low.
This gives you and your team the breathing room to act decisively. A few key features make this possible:
By putting your safety stock on autopilot, you reclaim valuable time and mental energy. You can finally focus on strategic growth, like marketing and product development, confident that your inventory is being managed with precision. It’s the modern, intelligent way to make sure you have exactly what you need, right when you need it.
Even with the best formulas, theory and reality are two different things. Once you start plugging numbers in, you'll inevitably run into practical questions about how to handle the messy, real-world side of inventory.
You're probably wondering about things like unreliable suppliers or how to plan for a big sale. Let's dig into some of the most common challenges we see Shopify merchants face.
This is a great question. Promotions are designed to create a demand spike, which means your normal historical data won't cut it. The trick is to treat that promotional lift as a separate, predictable event—not just random noise.
First, you need to forecast the expected sales lift from the promotion. A good starting point is to look at how similar products performed during past sales.
Once you have an estimate, you can add a portion of that expected lift to your safety stock for the promotional period only. For example, if you think you'll sell an extra 500 units, you might add 150-200 units to your buffer just in case the promotion really takes off. The key is to avoid permanently inflating your safety stock based on a one-off event.
Ah, the unreliable supplier. It’s one of the biggest drivers of stockouts and a massive headache for merchants. When a supplier's lead time is all over the map, you have to account for that variability directly in your calculations. This is where the statistical methods really prove their worth.
Instead of just using the average lead time, you need to calculate the standard deviation of lead time. A higher standard deviation means more unpredictability, and a good formula will factor this in. This gives you a buffer specifically designed to handle those delays.
A quick-and-dirty fix: If you know your supplier's average lead time is 10 days but sometimes it stretches to 30, just use the maximum (30 days) in your basic formula. It’s not as precise, but it builds a larger buffer to protect against those frustratingly long waits.
Definitely not. In fact, that would be a terrible use of your cash. This is where your ABC analysis becomes absolutely critical.
Your A-items—the products driving roughly 80% of your revenue—are non-negotiable. They are the heart of your business, and a stockout on one of these is incredibly costly. They absolutely need a carefully calculated safety stock.
But for your C-items? The slow-movers that make up a tiny fraction of sales? Holding safety stock for them ties up capital that could be working much harder for you elsewhere. For many of these products, it’s often more profitable to set a 0% service level target and simply accept an occasional stockout. That frees up cash to invest in keeping your bestsellers always available for your customers.
Ready to stop guessing and start making data-driven inventory decisions? Tociny.ai uses adaptive forecasting to automatically recommend the optimal safety stock for every product in your Shopify store. See how you can prevent stockouts and improve cash flow by visiting https://tociny.ai for early access.
Tociny is in private beta — we’re onboarding a few select stores right now.
Book a short call to get early access and exclusive insights.