
Picture this: you run a booming online coffee brand.
If you order a fresh batch of beans every single day, you'll get hit with constant shipping and processing fees. But if you buy a whole year's worth at once? You'll tie up a massive amount of cash and risk the beans going stale before you can sell them.
This is the classic inventory headache. The Economic Order Quantity (EOQ) is the simple but powerful formula that finds that perfect sweet spot, telling you the ideal amount of product to order to keep your total costs as low as possible.
At the end of the day, Economic Order Quantity is a practical calculation that helps you find the most cost-effective order size for your business. It's not just some dusty concept from a business textbook; it's a real-world tool that solves a fundamental problem for every D2C brand.
That problem is the constant tug-of-war between two different kinds of costs:
Order too often, and your ordering costs skyrocket. Order too much at once, and your holding costs will eat you alive. EOQ is the mathematical sweet spot where the sum of both these costs hits rock bottom.
We can see the direct consequences of getting this balance wrong pretty clearly.
| Ordering Strategy | Ordering Costs | Holding Costs | Risk of Stockouts | Impact on Cash Flow |
|---|---|---|---|---|
| Ordering Too Little | High. You're placing frequent orders. | Low. Less inventory sitting around. | High. You can easily run out of stock. | Strained. Constantly paying for shipping. |
| Ordering Too Much | Low. You're placing infrequent orders. | High. More capital and space are tied up. | Low. You have plenty of buffer stock. | Constricted. Cash is tied up in unsold goods. |
This table lays it bare: there's a direct trade-off with every ordering decision. EOQ gives you a data-driven way to find the most profitable middle ground.
Getting this balance right isn't just a minor optimization—it's a game-changer for your profitability.
When you order too much, you're not just paying for storage space. You're locking up precious cash that could be fueling your marketing campaigns, developing new products, or funding other growth opportunities. On the flip side, order too little, and you're staring down the barrel of frustrating stockouts, lost sales, and disappointed customers who might just shop with your competitor next time.
This isn't just theory. A 2023 analysis of 500 mid-sized retailers showed that businesses using EOQ principles cut their overstock by 28%, saving an average of $1.2 million each. Even better, stockout incidents plummeted by a massive 41%—a huge deal when stockouts can chew up nearly 10% of your potential revenue.
Finding your Economic Order Quantity is about more than just numbers. It’s about building an efficient, resilient, and financially healthy supply chain.
For any growing D2C brand, mastering EOQ is how you turn your inventory from a liability into a strategic asset. When you’re trying to trim inventory costs, it’s easy to forget all the little things that add up, from insurance to the physical infrastructure, like finding affordable storage units in Perth.
By optimizing your order quantities with EOQ, you ensure your capital is actively working for you, not just collecting dust on a warehouse shelf. It’s a foundational concept that paves the way for a much more stable and profitable business.
At first glance, the Economic Order Quantity formula can look like a throwback to high school algebra. But don't let the letters and square root fool you. It's actually a super practical tool designed to find the perfect balance point for your inventory.
Think of it as a recipe for efficiency. Each variable is an ingredient you already have on hand in your business. The formula is:
EOQ = √ (2DS / H)
Let's unpack what each letter really means for your D2C operations, turning these concepts into real numbers you can work with.
The first ingredient, Annual Demand (D), is the lifeblood of your business. It’s the total number of units you realistically expect to sell of a single product over a full year. This number reflects your customers' appetite for what you offer.
For example, if your Shopify store sells a popular eco-friendly laundry detergent and you moved 10,000 bottles in the last 12 months, then your D = 10,000. That’s your starting point.
Next up is Ordering Cost (S), sometimes called setup cost. This isn’t about the cost of the products themselves. Instead, it’s all the fixed expenses you rack up every single time you place an order with your supplier, no matter how big or small the order is.
This includes things like: * Shipping and freight fees: The straightforward cost to get products from your supplier to your warehouse. * Processing fees: Any handling charges your supplier tacks on. * Labor costs: The value of your team’s time spent creating purchase orders, emailing suppliers, and checking in the new shipment.
Let's say every time you reorder your best-selling skincare serum, it costs you $75 in shipping and staff time. That means S = $75. This is a fixed cost per order.
Finally, we have Holding Cost (H). This is the cost to store just one unit of a product for one entire year. These are the sneaky, often-overlooked expenses that quietly eat into your profits when cash is tied up in stock just sitting on a shelf.
Holding costs cover more than just warehouse space: * Warehouse Rent: The slice of your rent that a single product occupies. * Insurance and Taxes: The cost to protect your inventory from damage, theft, or other risks. * Obsolescence: The risk of products expiring, becoming last season's trend, or getting damaged in storage. * Capital Costs: The opportunity cost—what else could you have done with the money tied up in that unsold inventory?
If it costs you $4 per year to store one bag of your artisanal coffee beans (after factoring in all of the above), then H = $4.
The infographic below shows the classic tug-of-war that EOQ is designed to solve.
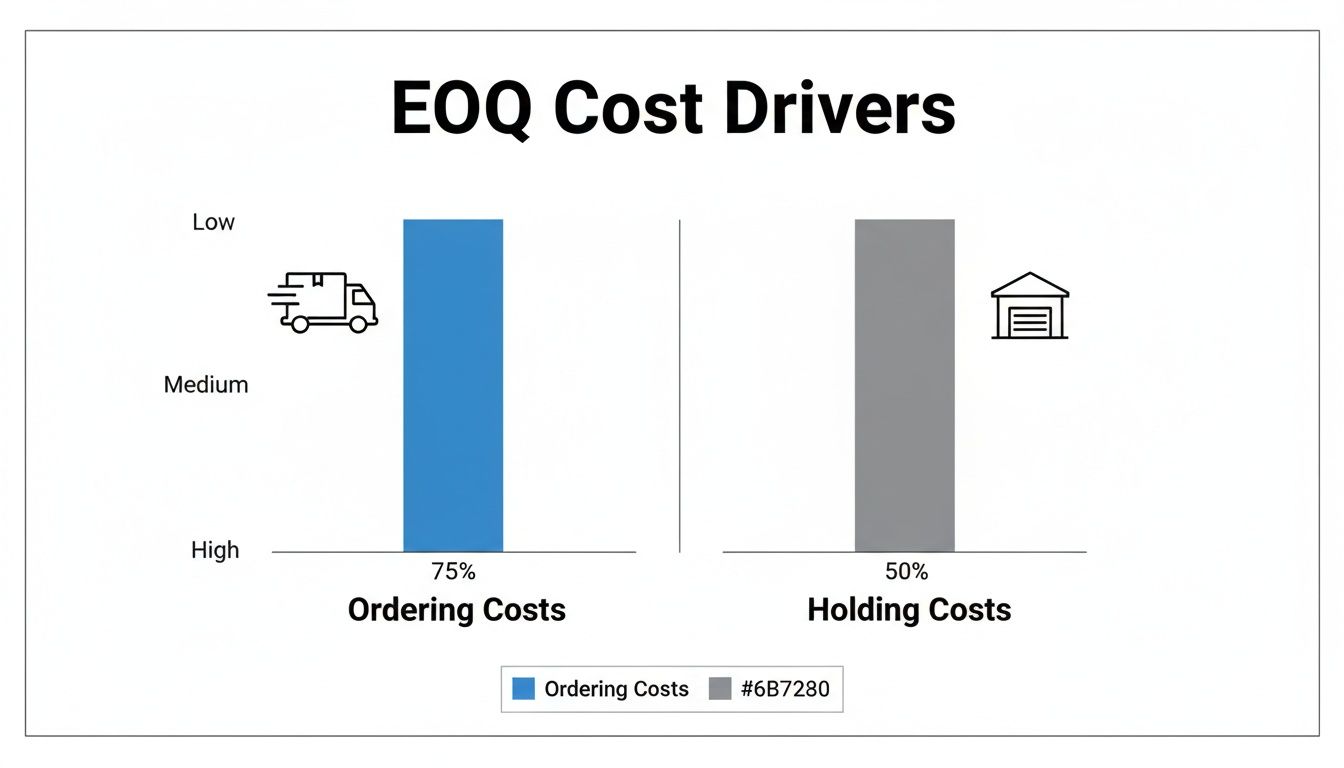
As you can see, ordering in small, frequent batches makes your ordering costs skyrocket. On the flip side, ordering huge quantities in one go sends your holding costs through the roof. EOQ finds that sweet spot right in the middle where your total cost is lowest.
This isn't just theory; it has a long history of driving real-world efficiency. After WWII, manufacturing firms used EOQ to balance post-war demand surges. One U.S. auto supplier famously cut its holding costs by 25% across a massive 50,000-part inventory between 1946 and 1955. For modern Shopify stores, the impact is just as significant. When combined with smart forecasting, EOQ can lead to total annual cost reductions of 18-24%. You can dive deeper into how EOQ has evolved to deliver these savings on Bizowie.com.
The Goal of the EOQ Formula: To calculate the specific order size where your total ordering costs and total holding costs are as low as possible for the year.
By translating your operational data into these three simple variables—Demand, Ordering Cost, and Holding Cost—you turn an intimidating equation into one of the most powerful tools in your inventory management toolkit.
Knowing the variables is one thing, but the true magic of the economic order quantity happens when you see it in action. Let's step away from the theory and walk through a calculation for a business just like yours.
Imagine you're running a Shopify store selling a killer artisanal hot sauce. Business is heating up, and you need a smarter way to manage your best-seller without either tying up all your cash in inventory or constantly disappointing customers by running out.
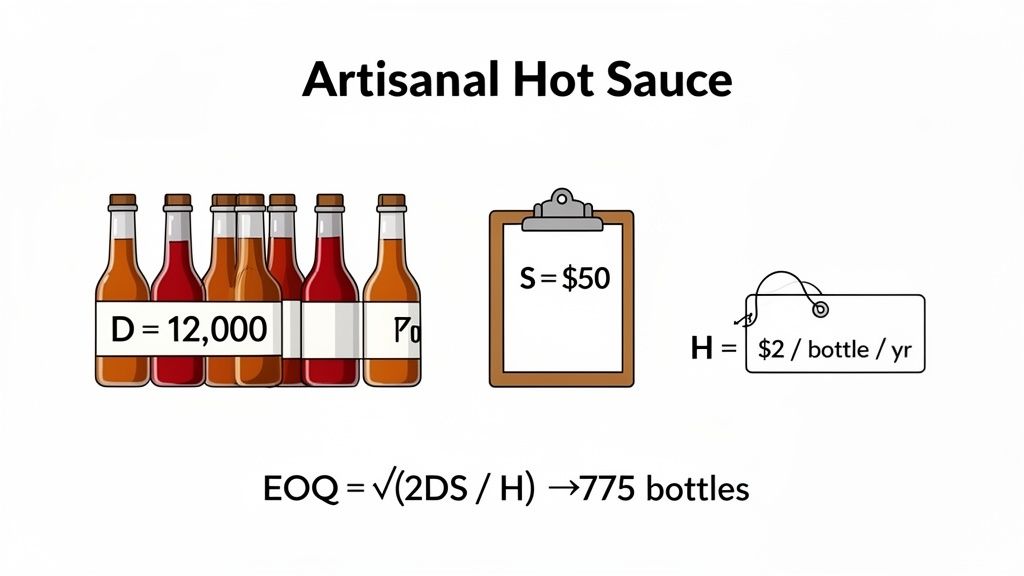
First things first, we need to round up the three key numbers for the EOQ formula. After digging into your sales data and operational costs, here’s what you find:
With these three pieces of the puzzle, you're ready to find your ideal order size.
Now, let's plug those numbers into the EOQ formula we broke down earlier:
EOQ = √ (2DS / H)
Multiply 2 by Demand and Ordering Cost:
Divide by the Holding Cost:
Calculate the Square Root:
Since you can't order half a bottle, you'll round to the nearest whole number. Your economic order quantity is 775 bottles.
This means that to keep your total inventory costs as low as possible all year long, your most efficient strategy is to order 775 bottles of hot sauce every single time you restock.
That number, 775, isn't just a random result. It's the perfect balance point where your annual ordering costs and holding costs meet in the middle, minimizing your total expenses. To see just how powerful this is, let's compare it to two other common (but less efficient) approaches.
Of course, for this to work in the real world, you need consistency. For example, e-commerce sellers must find the best suppliers for Amazon FBA to ensure their ordering costs and delivery times are predictable. The more reliable your inputs, the more accurate your EOQ will be.
Now, let's look at the cost comparison table.
| Ordering Strategy | Order Size | Number of Orders per Year | Annual Ordering Cost | Annual Holding Cost | Total Annual Cost |
|---|---|---|---|---|---|
| Ordering Too Little | 200 bottles | 60 orders | $3,000 | $200 | $3,200 |
| The EOQ Sweet Spot | 775 bottles | 15.5 orders | $775 | $775 | $1,550 |
| Ordering Too Much | 2,000 bottles | 6 orders | $300 | $2,000 | $2,300 |
The results are crystal clear.
When you order too little (200 bottles at a time), you have to place 60 different orders throughout the year. Your ordering costs explode, landing you with a total annual cost of $3,200.
On the flip side, ordering way too much (2,000 bottles) slashes your ordering costs but sends your holding costs skyrocketing. That strategy costs you $2,300 annually.
The economic order quantity of 775 bottles nails the perfect sweet spot, dropping your total annual cost to just $1,550. This simple calculation can literally save you thousands of dollars, showing the immediate financial upside of a data-driven inventory strategy.
The standard Economic Order Quantity formula is a fantastic tool, but it lives in a perfect, predictable world. The reality of e-commerce, however, is anything but. To really make EOQ work for you, you have to get familiar with its underlying assumptions and know when to bend the rules for the messy, dynamic nature of your business.
Think of the basic EOQ model like a map drawn on a perfectly flat piece of paper. It’s incredibly useful for getting your bearings, but it doesn’t show the real-world mountains, valleys, and unexpected detours you’ll hit on your journey.
The classic formula works so cleanly because it assumes several things are always true. Recognizing these assumptions is the first step to using the model intelligently.
These assumptions give us a clean baseline to work from, but they rarely reflect the day-to-day chaos of running a growing D2C brand.
One of the most common curveballs thrown at the standard EOQ is the supplier discount. Your formula might tell you the perfect order size is 775 units, but what if your supplier offers a 10% discount if you buy 1,000 units at a time? All of a sudden, the math gets a lot more interesting.
This situation forces you to compare the total costs for both options. You have to weigh the savings you'd get from the lower purchase price against the higher holding costs of storing all that extra inventory. The scenario with the lowest total cost—factoring in purchase price, ordering costs, and holding costs—is your new sweet spot.
The EOQ isn't a rigid rule; it's a starting point for smart decision-making. You always have to analyze how outside factors, like discounts, shake up your total cost equation.
So, what if you don't just sell products but also make them yourself? For D2C brands that produce their own goods, the standard EOQ model has a more suitable cousin: the Production Order Quantity (POQ) model, also known as the Economic Production Quantity (EPQ).
This model is built for situations where inventory arrives incrementally as it's produced, not all at once in a single big shipment. It accounts for your production rate, making sure you don’t overproduce and inflate holding costs while a production run is still in progress.
The evolution from the original 1913 EOQ formula shows its lasting impact, with businesses often reporting cost reductions between 15-30%. The POQ model is a perfect example of this. For instance, a food and beverage brand on Shopify producing 200 units per day against a demand of 100 could use POQ to calculate an optimal production run of 620 units, cutting inventory buildup costs by 19% compared to a standard EOQ calculation. While EOQ is powerful, real-world studies show it can be off by up to 15% due to its rigid assumptions—a gap that modern inventory software helps close. You can explore more about EOQ's historical development and variations on Wikipedia.
By understanding these limitations, you can move beyond a purely theoretical approach. You learn to treat the economic order quantity as a flexible guide, adapting its principles to fit the unique challenges and opportunities your business faces every single day.
Calculating your Economic Order Quantity is a massive step forward. It gives you the "how much," but it leaves a critical question unanswered: "When do I order?"
The classic EOQ formula works in a perfect world—one where suppliers deliver instantly and customer demand is perfectly predictable. To bring this powerful tool into the messy reality of running an e-commerce store, we need to pair it with two other crucial concepts: safety stock and reorder points.
Think of it this way: your EOQ is the ideal-sized fuel can for your car. Safety stock is the extra emergency can you keep in the trunk for unexpected traffic jams. The reorder point is your fuel gauge hitting that "time to fill up" mark. When all three work together, you get a reliable inventory system that runs on autopilot.
Safety stock is the extra inventory you hold as a cushion against the two biggest headaches in e-commerce: unpredictable demand and supplier delays. It’s your insurance policy against a sudden sales spike from a viral TikTok or a shipping bottleneck holding up your delivery.
Without this buffer, any little surprise could push you into a stockout, leading to lost sales and angry customers. The goal isn't to eliminate all risk—that would mean tying up way too much cash in inventory—but to have a reasonable buffer against everyday disruptions.
Figuring out the right amount of safety stock is a science in itself, often involving a close look at your historical sales data. You can learn more about how to precisely calculate the right safety stock for your products in our detailed guide. For now, just know this buffer is what turns a fragile supply chain into a resilient one.
Once you've established your safety stock, you can set your reorder point (ROP). This is the specific inventory level that acts as a trigger, telling you it’s time to place a new order. It’s the number that stops the guesswork.
The reorder point formula is simple but powerful, connecting your sales velocity, supplier lead time, and your safety buffer into a single, actionable number:
Reorder Point = (Average Daily Sales x Lead Time in Days) + Safety Stock
This formula makes sure you have enough stock to cover sales while you wait for the new shipment to arrive, plus your emergency stash. By setting a clear reorder point, you move from reacting to problems to proactively preventing stockouts before they can even happen.
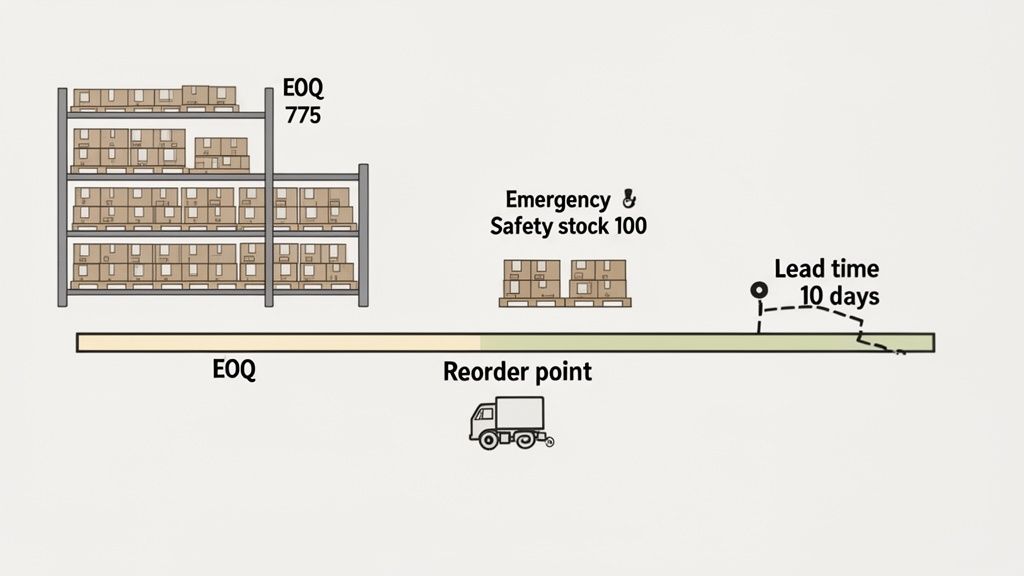
Let’s go back to our artisanal hot sauce Shopify store and see how this all comes together. We already figured out a few key numbers:
After looking at your sales data, you decide to keep 100 bottles as safety stock. That gives you about three extra days of sales cover for any unexpected demand spikes or minor shipping delays.
Now, let's calculate your reorder point:
Your reorder point is 430 bottles.
This creates a crystal-clear rule for your entire team. The moment your inventory of hot sauce drops to 430 bottles, you immediately place a new purchase order for your EOQ of 775 bottles. Just like that, you’ve turned a static formula into a dynamic, automated system that keeps your supply chain humming and your business profitable.
Let's be honest, manually crunching the Economic Order Quantity for every single product is a nightmare. Customer demand is a moving target, shifting with trends, seasons, and whatever is blowing up on social media this week. Spreadsheets can't keep up; they become outdated relics the moment you save them. This is where modern tech doesn’t just help—it changes the entire game.
AI-powered inventory platforms aren't here to replace the core logic of EOQ. Instead, they act like a supercharger for its principles, making the formula scalable, dynamic, and laser-focused for any growing D2C brand.
The biggest weakness of a hand-calculated EOQ is its total reliance on a static "Demand" number. You're basically making an educated guess. AI tools, on the other hand, deliver a far more accurate prediction by constantly chewing on complex data points in real time.
This isn't just about looking at last year's sales. It includes:
By processing all this information on a loop, AI gives you a demand forecast that breathes and reacts to the market. We take a much deeper look into how this works in our guide on leveraging AI for smarter demand forecasting. This process transforms the "D" in your EOQ formula from a shot in the dark into a data-backed prediction.
Beyond just forecasting, AI platforms can dynamically tweak your safety stock levels and reorder points based on what's happening now. If a supplier suddenly hits a shipping delay or one of your products goes viral on TikTok, the system can recalculate your ideal inventory position in an instant.
AI doesn’t just put calculations on autopilot. It builds a self-correcting inventory system that adapts to market swings, making sure you’re always a step ahead of stockouts or crippling overstock.
Think about it this way: Ford W. Harris introduced the EOQ model back in 1913. Ford Motor Company quickly adopted these principles in the 1910s and 1920s, optimizing production runs for parts like engine components. Historical records show this slashed their inventory holding costs by a massive 20-30% on key assembly lines.
Now, jump to today's e-commerce world, where stockouts cost brands 8-12% of sales globally. For D2C brands in fast-moving industries like fashion or electronics, using an AI forecasting engine like Tociny.ai prevents overstock, helping them hit 98% fulfillment rates while trimming waste by 15-20% every year. For more on this, check out the evolution of supply chain management on Meegle.com.
The dashboard below gives you a peek at how platforms like Tociny.ai make all this complex analysis simple and actionable.
This kind of visual approach lets you see sales trends and stock level predictions at a glance, turning sophisticated AI number-crunching into straightforward business decisions. By automating the heavy lifting, these tools free you up to focus on the big picture—strategy and growth—while feeling confident your inventory is perfectly tuned for profit.
Even after you've got the concepts down, putting EOQ into practice can bring up some real-world questions. Let's walk through a few of the most common ones we see from D2C operators.
Your EOQ isn't a "set it and forget it" number. Think of it as a living, breathing guide that needs a regular check-up to stay useful for your business.
A good rule of thumb is to run the numbers quarterly. But you should absolutely revisit the formula anytime a key variable shifts in a big way. This could be anything from negotiating new shipping rates with a supplier, switching to a new 3PL, or seeing a sustained spike or dip in a product's sales velocity.
This is a great question. The standard EOQ formula really shines with products that have steady, predictable demand all year round. If you try to apply it as-is to a highly seasonal item—say, a winter coat—you'll end up massively overstocked in the off-season.
A much smarter approach is to calculate a separate economic order quantity just for your peak season. For the rest of the year, it's often better to lean on more advanced forecasting tools that are built to handle those kinds of demand swings.
The most accurate holding cost is one you calculate yourself. Add up annual expenses for storage, insurance, labor, and capital tied up in inventory to find a percentage that truly reflects your business.
You’ll often hear an industry benchmark of 15-25% of your inventory's value for holding costs, but treat that number as a rough starting point, not a hard rule. Relying on a generic estimate can throw off your calculations and lead to the wrong ordering decisions.
Ready to move beyond manual calculations and supercharge your inventory strategy? Tociny.ai uses AI to automate demand forecasting and provide dynamic, data-driven recommendations that make EOQ principles scalable and precise for your Shopify store. See how you can reduce overstock and eliminate stockouts by visiting https://tociny.ai.
Tociny is in private beta — we’re onboarding a few select stores right now.
Book a short call to get early access and exclusive insights.