Getting your inventory turnover right is a delicate dance between sharp forecasting, smart pricing, and a well-oiled supply chain. It’s really about mastering the flow: buying just enough, selling it fast, and streamlining every step from your supplier to your customer's doorstep.
Low inventory turnover isn't just a number on a spreadsheet; it's a silent growth killer for your D2C brand. When products just sit there, they’re doing more than collecting dust—they're actively siphoning cash out of your business.
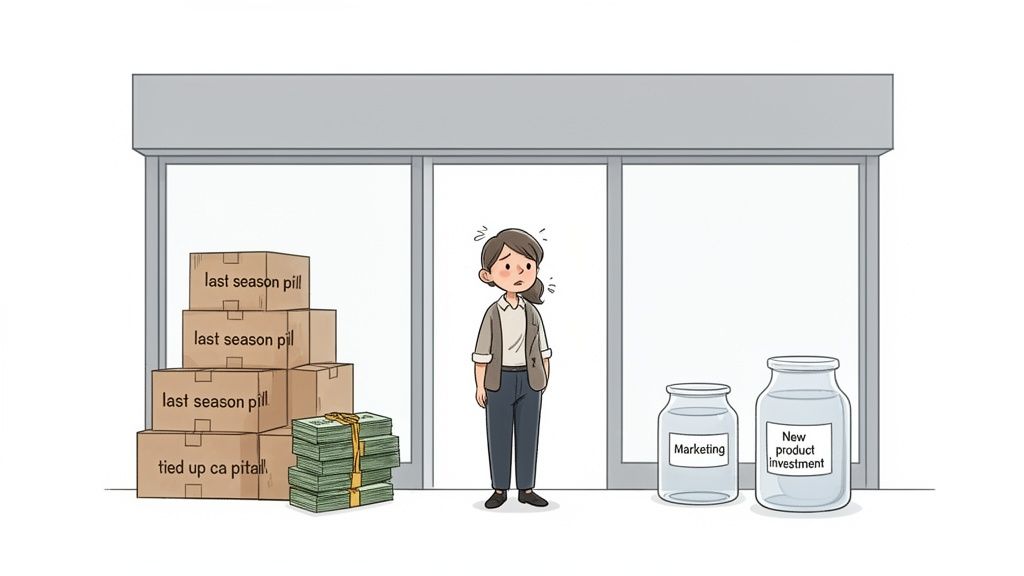
Let's paint a picture. A Shopify wellness brand goes all-in on a new line of seasonal supplements. They bought big, banking on a massive sales rush. But the trend fizzled out, and now, months later, they're stuck with pallets of expiring product and thousands of dollars in capital just… gone.
This is more than a storage headache. It’s a massive opportunity cost. That frozen cash could have been fuel for a new marketing campaign, R&D for a killer new product, or a re-stock of a proven bestseller. Instead, it’s just sitting in a box.
The pain of slow-moving inventory isn’t a one-time hit. It triggers a cascade of problems that hammer your profitability and clog up your operations.
Think about the downstream effects:
Here's the bottom line: poor inventory turnover is often a symptom of a deeper problem. It could be pointing to a flaw in your forecasting, a disconnect in your marketing, or a fundamental product-market fit issue. You have to fix it for the long-term health of your business.
In the cutthroat world of e-commerce, hitting that inventory turnover sweet spot can literally make or break you. Most D2C brands aim for 6-12 turns per year, easily outpacing brick-and-mortar's 4-6x rate, thanks to lower overhead and smarter demand signals.
Ultimately, improving your turnover isn’t just an accounting chore. It's about building a more agile, resilient business that can pivot when the market shifts. But before you can solve the problem, you need to know how to spot it. A great starting point is our guide on how to identify slow-moving inventory to kick off your diagnosis.
Before you can fix a problem, you have to know what you’re up against. Jumping straight into a new pricing or marketing strategy without a clear diagnosis is like trying to navigate a new city without a map—you’ll get lost, fast.
You need a clear, data-backed picture of what's happening on your shelves. This audit is your starting point, and it’s how you’ll separate your fast-moving heroes from the slow-moving villains that are tying up your cash.
The first and most fundamental metric for this health check is your inventory turnover ratio. In simple terms, this number tells you how many times you’ve sold and replaced your entire stock over a specific period.
The formula is pretty straightforward: Inventory Turnover = Cost of Goods Sold (COGS) / Average Inventory
If you're on Shopify, you don't need an accounting degree to find this. Your COGS is right there in your admin under Reports > Finances > Profit. To get your average inventory, just find the inventory value at the start and end of your chosen period (in Reports > Inventory), add them together, and divide by two.
Generally, a higher ratio means you’re running an efficient operation. A lower one is a red flag for overstocking or weak sales. For a deeper dive, check out our complete guide to inventory turnover rate calculation built specifically for D2C brands.
While your turnover ratio gives you a great 30,000-foot view, you need to zoom in to make smart, SKU-level decisions. A couple of other essential KPIs will bring your inventory health into much sharper focus.
Here's a quick rundown of the metrics I always recommend tracking for a complete picture.
| Metric | Formula | What It Tells You |
|---|---|---|
| Inventory Turnover | COGS / Average Inventory | How many times you sell and replenish your entire stock in a period. A high number is good! |
| Sell-Through Rate | (Units Sold / Units Received) x 100 | What percentage of a product's stock you've sold in a timeframe. Great for judging new launches. |
| Days on Hand (DOH) | (Average Inventory / COGS) x 365 | How many days' worth of inventory you're holding. Translates turnover into a simple timeline. |
Tracking these metrics together gives you a far more nuanced understanding of your inventory performance than looking at turnover alone.
Sell-Through Rate: This percentage shows how much of a product's stock you've sold within a specific timeframe, usually a month. It’s perfect for gauging the success of new product launches or seasonal items. A high sell-through rate means a product is really hitting the mark with your customers.
Days on Hand (DOH): Also known as Days Inventory Outstanding, this metric tells you the average number of days it takes to sell through your entire stock. It essentially translates your turnover ratio into a more intuitive timeframe. If your DOH is 90 days, it means you have enough stock to last three months at your current sales pace.
By combining these numbers, you go from a vague feeling that "some stuff isn't selling" to a precise understanding of exactly which products are tying up your capital, and for exactly how long. This is the crucial first step to taking targeted action.
Let's walk through a real-world example. Imagine you run a D2C home goods store.
After running the numbers, you discover your overall inventory turnover is 3.5x for the year—a bit sluggish for your industry. That’s the first red flag, but it doesn't tell you what to fix.
So, you dig deeper. You analyze the sell-through rate for your "Artisan Ceramic Vases" and find it's only 15% over the past three months. Ouch. Then you calculate the Days on Hand for this product line and see it’s a staggering 240 days. The vases are a certified inventory villain, sitting in the warehouse for eight months on average before selling.
On the flip side, your "Organic Cotton Throw Blankets" have a sell-through rate of 85% and a DOH of just 35 days. This is a clear inventory hero.
This simple audit immediately reveals where the problem is. Your store isn't struggling across the board; you have a specific product category that's draining resources. Now, instead of guessing, you can build a specific strategy for the vases. Maybe you bundle them with the popular blankets, run a targeted marketing campaign, or plan a strategic markdown to clear the stock and reinvest that cash into proven winners.
This data-driven approach is the foundation for effectively boosting your overall inventory turnover.
Once you've dug into your numbers and diagnosed your inventory health, you have the data you need to make surgical strikes. Improving your turnover isn’t about broad, sweeping changes. It’s about pulling specific, targeted levers that directly influence how quickly your products actually sell.
This is your playbook for turning those audit insights into cash in the bank.
But before we dive into tactics, it's worth getting a solid grasp on the fundamentals of understanding inventory optimization. The real goal here is to shift from putting out fires to building a proactive system that keeps your inventory flowing smoothly. We'll break down four key strategies you can put into action right away.
Moving away from "gut-feel" purchasing is probably the single most impactful change you can make. Your intuition is valuable, but hard data provides the roadmap for smarter buying decisions, which is the bedrock of a healthy turnover rate.
Start by digging into your historical sales data. Look for the obvious stuff first: patterns, seasonality, and recurring trends.
For instance, a Shopify store selling outdoor gear might notice a consistent 30% spike in hiking boot sales every spring. Instead of placing one massive, capital-intensive order in January, they can use this data to schedule smaller, more frequent deliveries that perfectly align with that demand curve. This simple shift prevents them from being overstocked in the winter and, just as importantly, understocked when sales start to heat up.
This is where advanced inventory analytics platforms like Tociny.ai really shine. They can automate this whole process, analyzing your sales history and market signals to generate freakishly accurate demand forecasts. The system can then recommend exactly what to order and when. It’s a fundamental shift from guessing to knowing.
This simple flowchart breaks down the core calculation, starting with your Cost of Goods Sold and Average Inventory.
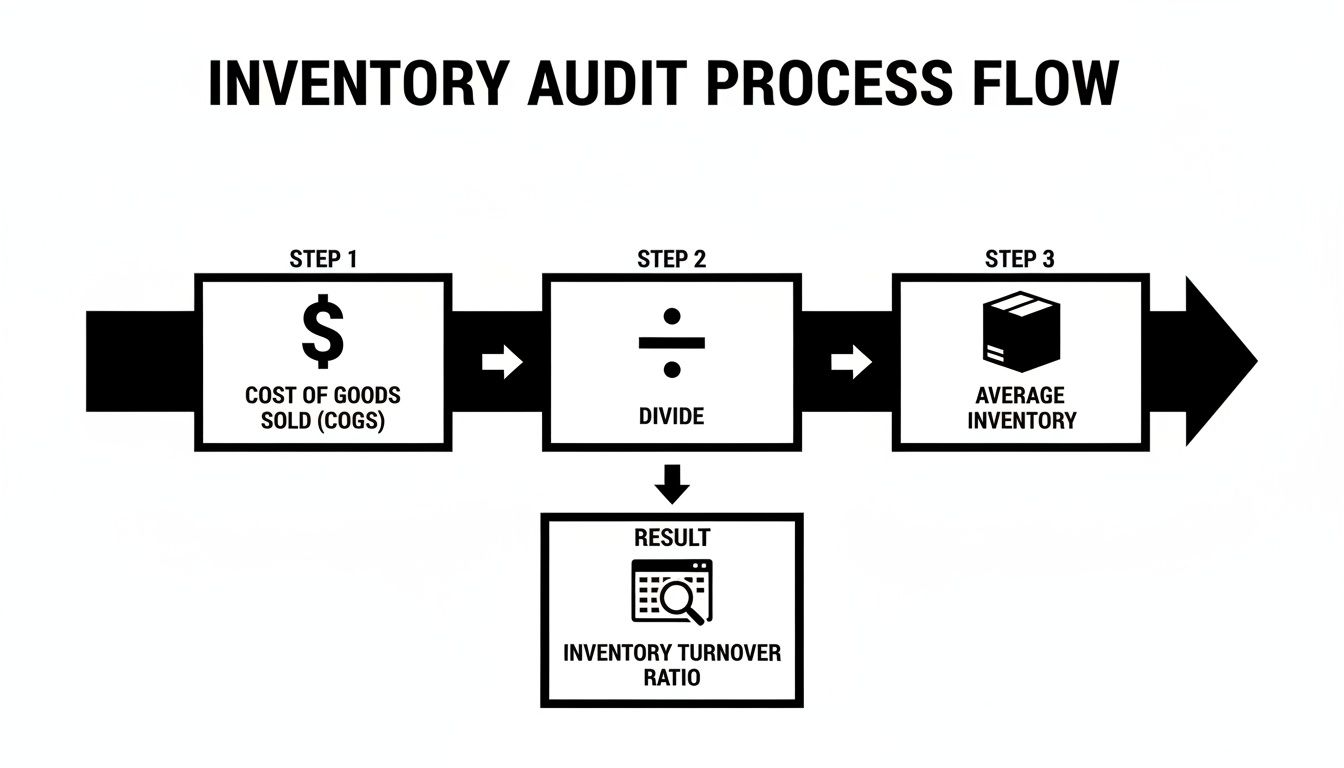
As you can see, it all starts with pulling accurate financial data from your sales channels to produce a turnover metric you can actually trust.
Pricing is a powerful lever for moving inventory, but you have to use it with precision. Blasting your entire store with constant discounts is a fast way to devalue your brand and train customers to just wait for the next sale.
Instead, think about targeted promotions designed to move specific, aging stock without cratering your margins.
Here are a few tactical approaches we’ve seen work wonders:
The key is to use promotions as a scalpel, not a sledgehammer. By focusing on specific inventory goals, you can juice sales velocity right where you need it most.
Bundling is one of the most effective—and frankly, underrated—strategies for clearing out slow-movers while also boosting your Average Order Value (AOV). It’s a win-win.
The trick is to pair a popular, high-velocity "hero" product with a complementary, slower-selling "sidekick" item.
Let's say a fashion brand is sitting on a pile of last season's scarves. They’re great scarves, but demand has cooled off. Instead of marking them down by 50%, they could create a bundle: "Buy our bestselling Merino Wool Sweater and get a Signature Scarf for just $10 more."
This single move accomplishes several things at once: 1. It moves the slow-moving scarves without a drastic, profit-killing markdown. 2. It dramatically increases the perceived value of the purchase for the customer. 3. It boosts the AOV, making every single transaction more profitable.
A well-crafted bundle feels like a curated deal to the customer, not a desperate attempt to clear old stock. It frames the slower product as a value-add, which is far better for your brand than sticking it on a clearance page.
This isn't just for small D2C brands. Look at IBM, a tech giant that's been around since 1911. They completely transformed their inventory game in just five years. Back in fiscal year 2021, their inventory turnover ratio was a respectable 14.6x. Today, it has soared to 22.5x—an incredible 54% jump that proves how much these strategic shifts matter.
Finally, let's talk about the long game: regularly pruning your product catalog. Not every product deserves to be a permanent fixture. You have to use your sales data—specifically metrics like sell-through rate and days on hand—to make the tough but necessary calls about your assortment.
Your inventory audit should have clearly identified your winners and your losers. Now it's time to act on that intel.
This isn't about having fewer products; it's about having the right products. A tighter, more curated assortment of high-performers will naturally lead to a higher inventory turnover rate, freeing up your capital and simplifying your entire operation.
Smart sales and marketing can definitely move products, but to truly get a handle on your inventory turnover, you need to look further upstream. Your supply chain and reordering processes are the real engine room of your business. A tight, responsive supply chain creates a positive ripple effect, improving your cash flow, slashing holding costs, and ultimately cranking up your turnover rate.
It all begins with getting an honest, clear picture of your supplier lead times—that's the total time from the moment you place an order to when that product is actually in your warehouse, ready to be sold. A ton of D2C brands make the mistake of only tracking the shipping time, but the real formula is much bigger than that.
Lead Time = Order Processing Time + Production Time + Shipping Time
Getting this number wrong is a recipe for disaster. It leads to painful stockouts on one hand or panic-induced over-ordering on the other, both of which will absolutely tank your turnover metrics.
Once you know your true lead times, you can start to whittle them down. Shaving even a few days off the total can dramatically reduce how much safety stock you need to keep on hand.
Start a conversation with your suppliers. Ask them where the bottlenecks are. Is it on their production floor? Is it in packing? Maybe it's something else entirely. You might be surprised.
Often, just giving them a better line of sight into your sales forecasts helps them plan more effectively, which in turn helps you. This is also the perfect opening to talk about order quantities.
The old-school approach of placing massive, infrequent orders just to snag a volume discount is often a trap. It ties up a huge chunk of capital and leaves you totally exposed if customer demand suddenly shifts. The real goal should be to negotiate for smaller, more frequent orders that actually match your sales velocity.
This keeps your inventory lean and your cash flowing. You'd be surprised what a strong supplier relationship can unlock; more flexible terms are often on the table if you just ask.
Your reorder point (ROP) is the exact stock level that tells you, "Hey, it's time to order more." Nailing this is a science, not a guessing game. It’s what prevents stockouts on your bestsellers without forcing you to sit on a mountain of excess inventory.
Effective supply chain management is a data-heavy game. Embracing data-driven decision-making can fundamentally change how you manage your inventory, leading to some serious improvements in your turnover rate.
Here's the basic formula to get you started:
Reorder Point = (Average Daily Sales x Lead Time in Days) + Safety Stock
Let's make that real.
Imagine you sell a popular face serum. * Average Daily Sales: 20 units * Supplier Lead Time: 15 days * Safety Stock: 50 units (your buffer for those unexpected demand spikes)
Your ROP would be (20 x 15) + 50 = 350 units. As soon as your inventory for that serum drops to 350, you know it's time to hit "reorder."
This simple calculation takes all the stress and guesswork out of the equation. It replaces those "oh no, we're almost out!" moments with a calm, repeatable system. And honestly, automating this is a total game-changer.
Plenty of inventory tools, including platforms like Tociny.ai, can watch your stock levels in real-time and automatically flag any SKUs that are getting close to their reorder points. This proactive approach means you're never caught flat-footed.
By refining these three core areas—your lead times, order frequency, and reorder points—you build a supply chain that’s no longer just a cost center. It becomes a strategic asset, a system designed to keep inventory moving, cash flowing, and your customers happy.
Let's be honest: manually juggling forecasting, pricing, and reordering across hundreds of SKUs is a nightmare. This is exactly why so many top-performing D2C brands are moving beyond spreadsheets and embracing AI-powered platforms to get an edge.
These tools aren't just a fancier version of your basic Shopify reports. Instead of just showing you what happened last month, they use artificial intelligence to tell you what’s likely to happen next and give you concrete steps to improve your inventory turnover.
It’s a fundamental shift from being reactive to proactive. The proof is in the numbers. The inventory turnover market is now a $7.6 billion industry, with North America alone making up a 45% share. And it's growing at a blistering 19.6% CAGR. Why? Because smart inventory optimization is the only way to survive the constant battle against stockouts and overstock. You can read the full research about the inventory market's growth on htfmarketinsights.com.
Think of an AI-powered inventory platform as a dedicated analyst working for you 24/7. It’s constantly sifting through your sales data, market trends, and even your marketing calendar to spot opportunities and risks you’d almost certainly miss on your own.
These systems are built to give you clear, data-backed answers to your most pressing questions:
This kind of insight lets you make faster, more confident decisions that have a direct and immediate impact on your cash flow.
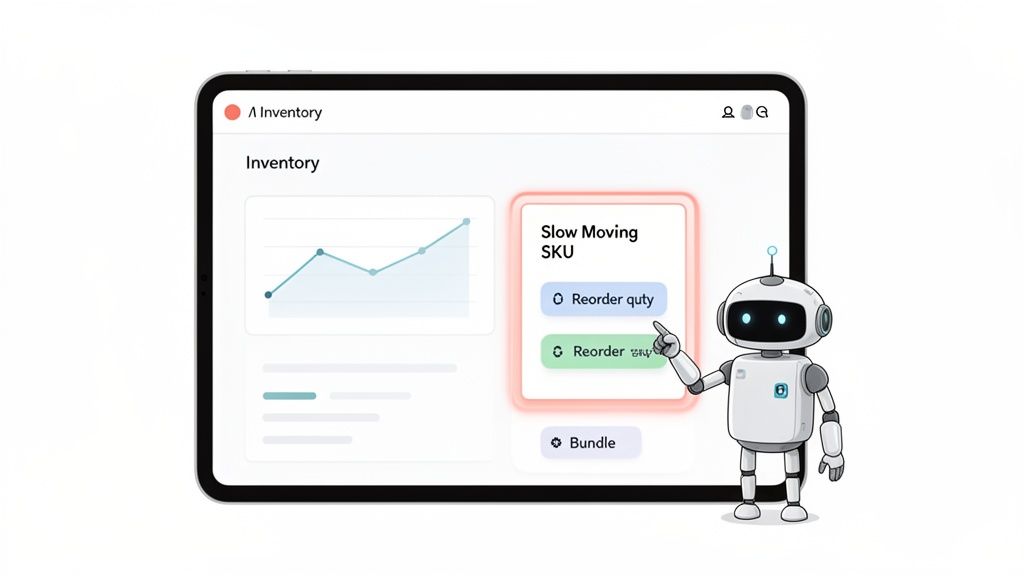
Picture this: It’s Monday morning, and you run a Shopify store that sells consumer electronics. You log into your inventory analytics dashboard.
Instantly, you see a glaring alert. Sales for your "Stealth-X Gaming Mouse" shot up 40% over the weekend, probably thanks to a popular streamer who featured it. The system calculates that your current stock will now be gone in eight days, not the 30 you had planned for.
But the AI doesn't just point out the fire; it hands you the extinguisher. It recommends an immediate reorder of 250 units to meet the new demand curve and prevent a stockout that would kill your momentum.
At the same time, it’s found another opportunity. An older "Viper-3 Headset" has a sell-through rate of just 12% and is tying up capital. The AI suggests creating a "Pro Gamer Bundle" that pairs the hot-selling Stealth-X mouse with the Viper-3 headset at a small discount.
This one suggestion solves three problems at once: 1. It capitalizes on the sudden demand for the gaming mouse. 2. It moves aging headset inventory without having to resort to deep, profit-crushing markdowns. 3. It boosts the Average Order Value (AOV) for every sale of that bundle.
In just a few clicks, you've dodged a stockout, cleared out slow-moving stock, and increased profitability—all before your first coffee. That’s the real power of using AI to improve inventory turnover. By handing off the complex analysis, these tools free you up to focus on strategy and growth. For brands ready to make smarter inventory choices, digging into predictive analytics for ecommerce is the obvious next step.
Even when you've got a solid plan, a few specific questions always seem to pop up once you start digging into your inventory data. Let's tackle some of the most common ones I hear from D2C founders trying to get their turnover rate right.
There’s no single magic number here. That said, a healthy ballpark for most D2C brands is somewhere between 6 and 12.
But this number can swing wildly depending on your niche. If you're in fast fashion or selling supplements, you're probably aiming for 10 or higher since your products are either trend-driven or have a shelf life.
On the other hand, a D2C furniture brand or a high-end electronics store might find that a ratio of 4-6 is fantastic. That’s totally normal when you’re dealing with higher product costs and a much longer, more considered sales cycle.
The best move? Benchmark against your specific industry, but more importantly, focus on improving your own ratio quarter over quarter. Chasing progress is always more valuable than chasing a perfect number.
Absolutely. While a strategic markdown has its place, leaning on discounts too heavily is a fast way to kill your brand's value and torpedo your profit margins. It should be a last resort, not your first move.
Before you start slashing prices, try these non-discount alternatives first:
For most D2C brands, running the numbers quarterly is the sweet spot. It’s frequent enough to catch trends as they're developing and make smart adjustments, but not so often that you get bogged down by meaningless daily blips.
Now, if you're in a super fast-paced industry—think consumables, apparel, or anything seasonal—you'll want to calculate it monthly. This gives you a much quicker trigger finger to react to sudden shifts in what your customers want.
Your annual turnover ratio then becomes your big-picture benchmark. It's perfect for your end-of-year review and for setting strategic goals for the next one. Of course, this is where an analytics tool really shines, automating the whole process so you can pull these insights whenever you need them. That data is the foundation for building a more agile and profitable business.
Ready to stop guessing and start making inventory decisions based on data? Tociny.ai swaps out those messy spreadsheets for clear, actionable insights powered by AI. Finally get a handle on your slow-movers, perfect your reordering, and watch your turnover rate climb. Join our private beta for early access at https://tociny.ai.
Tociny is in private beta — we’re onboarding a few select stores right now.
Book a short call to get early access and exclusive insights.