
Inventory control is all about the day-to-day supervision of your products. Think of it as the air traffic control for your warehouse. It’s the hands-on system that guides stock from your shelves to your customer's doorstep, making sure every item lands safely without delays or costly mistakes.
People often use "inventory control" and "inventory management" interchangeably, but they're two sides of the same coin. Inventory management is your high-level strategy—the "what" and "why" of your stock. Inventory control is the on-the-ground execution—the "how" and "where."
It’s the physical act of receiving, counting, tracking, and shipping your goods. Without solid control, even the best management strategy falls apart.
Imagine you run a popular bakery. Your inventory management strategy is to never, ever run out of your best-selling croissants. The inventory control system is the baker on the floor making sure the oldest dough gets used first (that’s FIFO in action), tracking exactly how many croissants are on the shelf, and flagging when flour supplies are getting low. One is the game plan; the other is how you win the game.
For any direct-to-consumer brand, getting a handle on inventory control isn't just a logistical chore—it's the bedrock of profitable growth. When you don't have a clear view of your stock, you’re basically inviting expensive problems to dinner.
Poor inventory control is a silent killer for promising e-commerce businesses. It directly drains your cash flow, erodes customer trust, and tanks your operational efficiency by creating a nasty cycle of stockouts and overstock.
When you nail your inventory control, you'll see tangible benefits that go straight to your bottom line:
Ultimately, a tight inventory control system lets you make smarter buying decisions. Instead of guessing how much to order, you can lean on accurate data to build your strategy. This is where models like the Economic Order Quantity become so powerful. To see how it helps find the perfect reorder balance, check out our guide on what is Economic Order Quantity.
Alright, you're sold on the why of inventory control. Now comes the fun part: the how. Choosing the right methods to organize and value your stock isn't just an accounting chore—it's about building a practical framework that directly impacts your profit, taxes, and day-to-day operations. Get this right, and your warehouse actions will finally sync up with your financial strategy.
Think of these methods as different playbooks for your inventory. Each one gives you a distinct way to track costs and move products. The best choice? That depends entirely on what you sell.
FIFO (First-In, First-Out) is probably the most intuitive model out there. The principle is simple: the first products that arrive at your warehouse are the first ones you sell.
Imagine a local bakery. To make sure every customer gets the freshest loaf, the baker puts the newest bread at the back of the shelf, pushing the older ones forward. This keeps anything from going stale. For e-commerce brands selling perishables—food, supplements, or cosmetics with expiration dates—FIFO isn't just a good idea; it's non-negotiable.
Beyond just managing freshness, FIFO offers a clear, logical way to value your inventory. It matches your cost of goods sold with your oldest purchase costs, which is super helpful for financial reporting, especially when prices are stable or even falling.
On the flip side, we have LIFO (Last-In, First-Out). This method works on the assumption that the most recently acquired inventory gets sold first. It’s definitely less common in e-commerce, but it has its place.
Picture a giant pile of coal at a power plant. New coal gets dumped right on top, and when a worker needs some, they scoop it from the top. The coal at the bottom might sit there for ages. This works because, well, coal doesn't expire. LIFO is often used for homogenous, non-perishable goods like raw materials or building supplies.
Financially, LIFO can be a strategic move during periods of rising prices (hello, inflation!). By matching your most recent—and therefore higher—costs against current revenue, you can report lower profits and potentially reduce your tax bill. Just be aware: LIFO isn't permitted under International Financial Reporting Standards (IFRS), making it a no-go for many global businesses.
Key Takeaway: The choice between FIFO and LIFO isn't just about logistics—it's a critical financial decision. FIFO reflects the actual physical flow of goods for most businesses and is widely accepted. LIFO is more of a specialized accounting tool for navigating costs in an inflationary environment.
Let's be honest: not all of your products are created equal. Some items fly off the shelves, while others seem to be collecting dust. ABC analysis is a game-changing technique that helps you prioritize by sorting products based on their value to your business.
It’s the classic Pareto Principle—the 80/20 rule—applied directly to your stock. The core idea is that roughly 80% of your revenue is generated by just 20% of your products. ABC analysis is how you find that critical 20%.
By segmenting your inventory this way, you stop treating every SKU the same. You can finally focus your limited time, money, and energy on the "A" items that are truly driving your business forward.
To help you keep these models straight, here's a quick comparison:
This table breaks down the most common models at a glance, helping you figure out which playbook is the right fit for your brand's unique needs.
| Model | Best For | Primary Goal | Example Use Case |
|---|---|---|---|
| FIFO | Perishables, electronics, or items with a shelf life. | Ensuring product freshness and logical cost flow. | A coffee roaster selling beans based on roast date. |
| LIFO | Non-perishable, homogenous goods (e.g., raw materials). | Tax advantages during periods of rising costs (inflation). | A construction supplier selling gravel from a large pile. |
| ABC Analysis | Businesses with a diverse catalog of products. | Prioritizing inventory management efforts on high-value items. | An online fashion store focusing on its best-selling dresses ("A" items). |
| EOQ/ROP | Any business wanting to automate and optimize reordering. | Minimizing total inventory costs (holding + ordering). | A Shopify store automatically reordering its most popular skincare product. |
Choosing the right combination of these models transforms inventory from a reactive headache into a proactive, strategic asset.
Beyond how you value and prioritize inventory, you need to know exactly when and how much to reorder. Two fundamental models help you answer these questions with data, not just a gut feeling: Economic Order Quantity (EOQ) and Reorder Point (ROP).
The path you take here has real consequences. Good inventory control puts your business on a trajectory for growth, while poor control creates a cycle of problems.
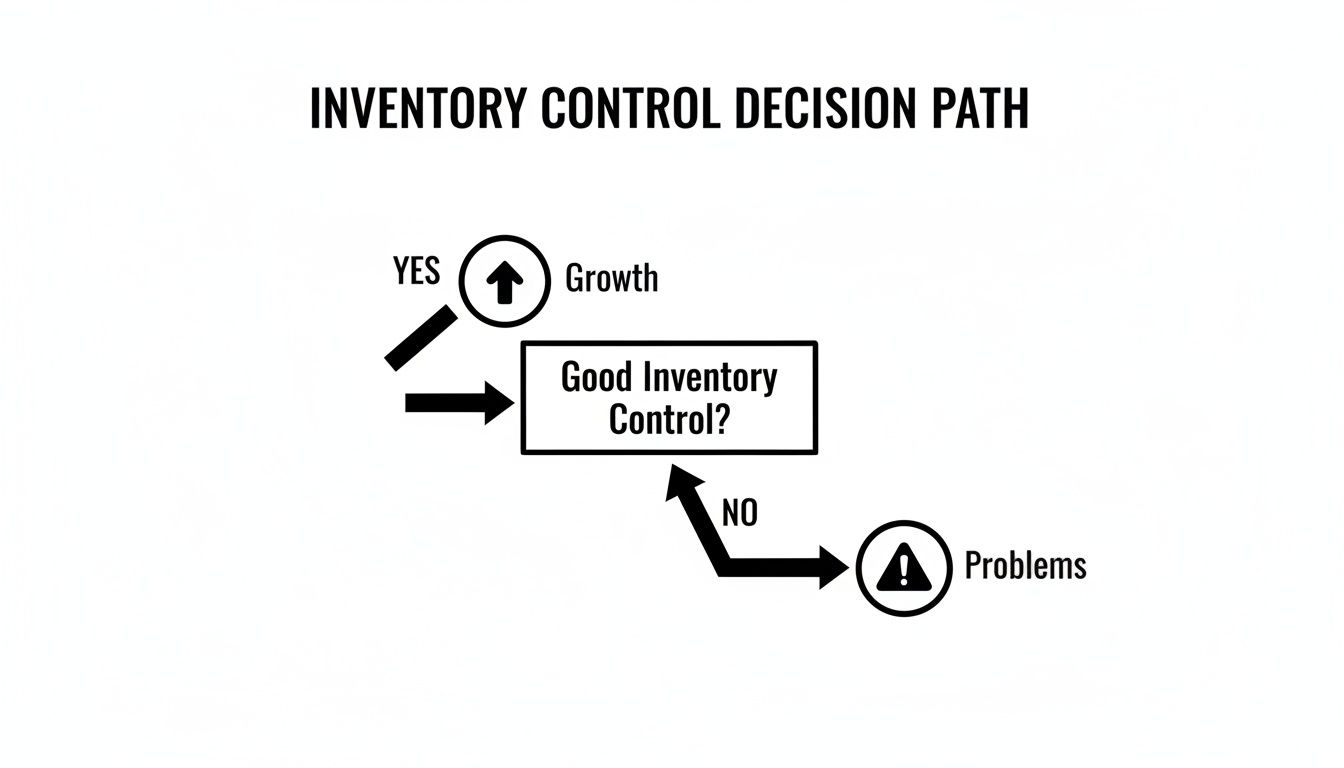
This flowchart says it all. Mastering your stock isn't just an operational task; it's a strategic decision that separates a thriving business from one that's constantly putting out fires.
So, how do you get on the right path?
Economic Order Quantity (EOQ) helps you find the perfect order size. It’s a formula that balances two conflicting costs: the cost of holding inventory (storage, insurance, capital tied up) and the cost of ordering it (shipping, processing fees). Ordering way too much at once bloats your holding costs. But ordering too little leads to frequent, expensive reorders and the risk of stockouts. EOQ calculates the "sweet spot" that minimizes your total inventory costs.
Reorder Point (ROP) tells you when to place that order. Think of it as the low-fuel light in your car. It’s a specific stock level that, once hit, triggers a new purchase order. The ROP is calculated based on your average daily sales and your supplier’s lead time, ensuring new stock arrives just as you're about to run out.
When used together, EOQ and ROP create a proactive, data-driven system for replenishment that takes the guesswork out of keeping your shelves stocked.
Without the right metrics, your inventory data is just a bunch of numbers. Great inventory control isn’t about collecting data for the sake of it—it’s about turning that data into insights that help you make smarter, faster decisions.
By zeroing in on a few critical Key Performance Indicators (KPIs), you get a clear, honest look at your store's operational health and financial efficiency. Think of these metrics as the diagnostic tools for your business, helping you spot trouble before it spirals.
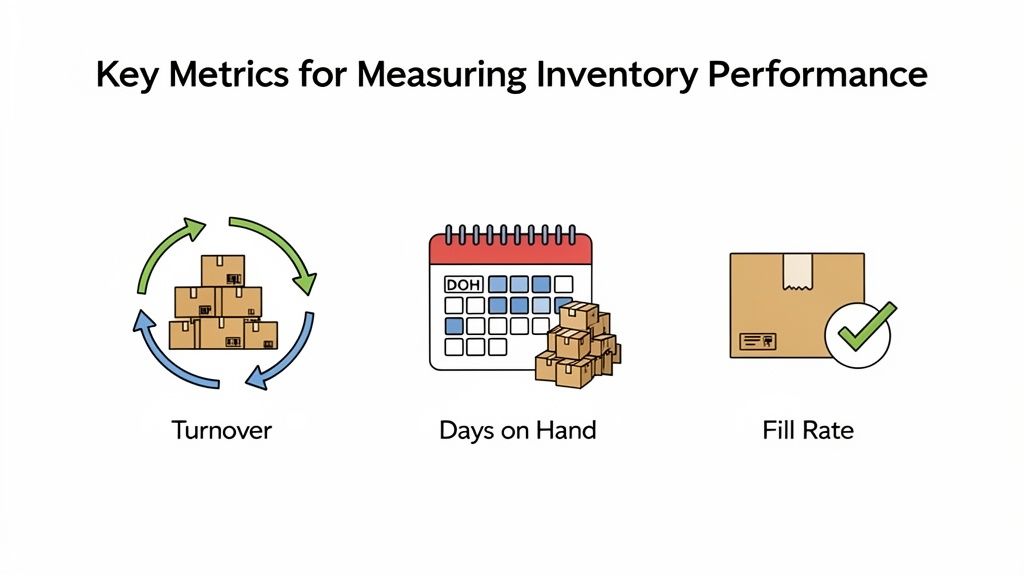
Let’s break down the three essential KPIs every e-commerce brand should be tracking.
Think of the Inventory Turnover Ratio as the pulse of your business. It’s a powerful metric that tells you exactly how many times you sell through and replace your entire stock over a certain period, usually a year. It’s the most direct measure of how efficiently you’re turning products on the shelf into cash in the bank.
A high turnover is a great sign. It’s like a popular restaurant that’s always flipping tables—products are flying out the door, cash is flowing, and nothing has a chance to get old. A low turnover, on the other hand, means your products are gathering dust, tying up capital that could be used elsewhere.
To figure it out, just divide your Cost of Goods Sold (COGS) by your average inventory value. A consistently low number is a major red flag for overstocking or weak sales. We dive deeper into the specifics in our guide on the inventory turnover rate calculation.
While turnover tells you how fast you’re selling, Days of Inventory on Hand (DOH) tells you how long your current stock will last. Sometimes called Days Inventory Outstanding (DIO), this metric gives you the average number of days it takes to sell through your inventory.
It's essentially the fuel gauge for your business. DOH answers one simple, crucial question: "If we stopped ordering new stock today, how long could we keep selling before we run out?"
Generally, a lower DOH is better. It means you aren’t sitting on stock for too long and your cash is working for you, not against you. But be careful—a DOH that’s too low is risky, leaving you vulnerable to stockouts from a sudden demand spike or supplier delay. The sweet spot is finding a balance that works for your sales cycle, ensuring you have enough fuel in the tank without weighing the business down.
Tracking these metrics gives you the clarity needed to optimize your operations. This is more critical than ever, as forecasts show that by 2025, a staggering 77% of retailers will use real-time inventory visibility and analytics to keep up with modern supply chain demands. You can read more about these retail trends on meteorspace.com.
Finally, there’s the Fill Rate, which is your most direct measure of customer happiness. This metric shows the percentage of customer orders you can ship completely and on time, right from your available stock—no backorders, no delays, no excuses.
A high fill rate, ideally above 95%, proves you’re consistently meeting customer expectations. It builds trust and loyalty because shoppers learn they can count on you to have what they want, when they want it. It's the ultimate report card for how well your inventory system aligns supply with actual demand.
A low fill rate is a clear sign of frequent stockouts. This doesn’t just mean lost sales today; it can seriously damage your brand’s reputation over time. Monitoring your fill rate helps you pinpoint which products are constantly out of stock so you can fix your reordering strategy.
Moving from theory to practice is where the real magic in inventory control happens. A few battle-tested best practices can turn your warehouse from a reactive cost center into a strategic asset that fuels your growth. It’s all about building a system driven by data, not guesswork.
Think of safety stock as your inventory insurance policy. It's that extra bit of a product you keep on hand to guard against the unexpected. Maybe a product suddenly goes viral on TikTok, or your supplier hits a snag and a shipment is delayed.
Without that buffer, a single disruption can trigger a stockout, leading to lost sales and unhappy customers. The trick is calculating the right amount—you need enough of a cushion to stay protected, but not so much that you're tying up cash in products that are just sitting there.
When businesses get serious about data-driven inventory, the results speak for themselves. One study found they cut stockouts by 23%, ramped up inventory turnover by 32%, and slashed carrying costs by 18%. It's no wonder that 77% of retailers are now planning to get real-time visibility through automation and analytics. You can find more insights about these 2025 inventory management trends on iposos.com.
Trying to reorder products manually is a recipe for disaster. Relying on someone's gut feeling or a messy spreadsheet to decide when to restock is inefficient and just plain risky. This is where automated reorder policies, powered by the Reorder Point (ROP) model, are a game-changer.
When you set up an automated system, you can define a specific inventory level that automatically triggers a new purchase order when stock gets low. It creates a consistent, timely replenishment cycle and prevents those costly stockouts that happen from simple human oversight.
Let's be honest: not every product in your catalog is a winner. Some items, often called 'zombie' or 'dead' stock, barely move but continue to hog valuable warehouse space and lock up your cash. SKU rationalization is the process of analyzing your product list to identify and cut these underperformers loose.
Think of it like pruning a garden. By trimming away the weak branches, you give the stronger ones more room to thrive. The process is straightforward:
This disciplined clean-up frees up capital and shelf space, letting you reinvest in your top sellers and explore new products with real potential. A solid inventory system is the backbone of many practical merchandising strategies that aim to boost sales and profits.
The annual, all-hands-on-deck physical inventory count is an event most businesses dread. It’s disruptive, eats up a ton of time, and usually means shutting down operations for a day or more. There’s a much better way: cycle counting.
Instead of counting everything once a year, cycle counting involves checking small, targeted sections of your inventory on a continuous, rotating schedule. For example, you might count your 'A' category top-sellers every month, your 'B' items each quarter, and your 'C' items twice a year.
This approach has some huge advantages: 1. Minimal Disruption: You can count products during normal business hours without bringing your entire warehouse to a halt. 2. Greater Accuracy: By catching and fixing mistakes more often, your inventory records stay incredibly accurate all year long. 3. Find the Root Cause: Frequent counting helps you quickly figure out why discrepancies are happening, whether it's a problem in receiving, a picking error, or even theft.
By switching from a once-a-year scramble to a steady, manageable process, cycle counting ensures your data is always reliable. That solid data is the foundation for every other inventory control effort you make.
Traditional inventory control, even when done right, often comes down to looking at past data and making an educated guess. It’s a bit like navigating with an old paper map—it gets you there, but it can’t warn you about the traffic jam just around the corner. Artificial intelligence turns that static map into a live GPS, acting as an intelligent co-pilot for your entire operation.
Modern AI-powered tools are a world away from static spreadsheets. They dig through complex patterns, predict what’s coming next, and turn mountains of data into clear, simple advice. This isn’t just about being more efficient; it's about building a business that’s more resilient, proactive, and ultimately, more profitable.
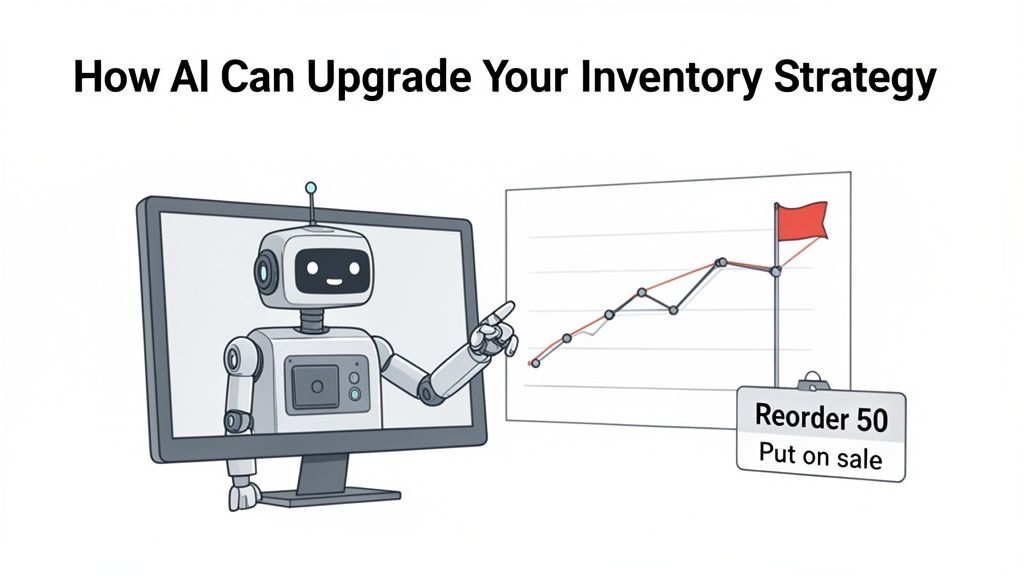
As you can see above, a platform like Tociny.ai gives you specific, data-backed suggestions. Instead of just showing you a bunch of numbers, it tells you what they mean for your next move.
One of the biggest upgrades AI brings to the table is adaptive forecasting. Standard methods look backward, projecting future sales based on what’s already happened. AI, on the other hand, looks in every direction at once.
It doesn’t just analyze your sales history. It also pulls in external factors like market trends, competitor pricing, seasonality, and even upcoming holidays. By spotting subtle connections the human eye would miss, AI can predict demand with an accuracy that manual methods just can't touch. This lets you stock up intelligently before a sales surge and pull back before a dip. If you're curious about the different approaches, check out our detailed guide on demand forecast methods.
This forward-looking ability is quickly becoming essential. The global inventory optimization market is currently valued at USD 5.87 billion and is expected to hit USD 12.42 billion by 2032, largely driven by the intense demands of e-commerce. With software holding a massive 67.6% market share, it's clear that smart digital tools are leading the way.
Every business has those head-scratching moments in their sales data. A product suddenly sells ten times faster than usual, or a reliable seller inexplicably stops moving. Trying to spot these anomalies manually in time to do something about them is next to impossible.
This is where AI-driven anomaly detection comes in. It acts as a 24/7 watchdog for your inventory, constantly monitoring your sales data. The second it flags any unusual activity—a sudden spike, a sharp drop, or a weird new trend—it alerts you.
This means you can react in hours, not weeks. For instance: * Sudden Spike: Is it a new trend taking off? A shout-out from an influencer? You can investigate and reorder before you stock out. * Sudden Drop: Did a competitor just launch a huge sale? Is there a new issue with your product listing? You can jump on the problem before it hurts your bottom line.
This kind of real-time oversight stops small hiccups from turning into major financial headaches. To get a better sense of the financial impact, exploring the true cost savings of automated inventory control can offer some valuable perspective.
Maybe the most powerful thing AI does for inventory control is provide actionable recommendations. Data is pretty useless if you can’t figure out what to do with it, and AI platforms like Tociny.ai are built to be your personal translator.
Instead of throwing dense dashboards and confusing charts at you, the system tells you exactly what your next step should be.
An AI co-pilot doesn't just show you the problem; it hands you the solution. It translates complex signals into straightforward, profitable actions that you can implement immediately.
You get clear, simple advice that directly impacts your revenue and cash flow. A good AI tool will give you suggestions like: * "This product's sales have slowed by 40%. Consider a 15% discount to clear stock." * "Based on recent trends, you should reorder 75 units of your top-selling SKU to avoid a stockout in 12 days." * "These three products are your most profitable. Feature them in your next marketing campaign."
By turning analytics into action, AI empowers you to make smarter, faster, and more confident decisions. It closes the gap between knowing what’s happening and knowing what to do about it, giving your brand a serious competitive edge.
Even with a solid grasp of the methods and metrics, questions always pop up when you're in the trenches. Let's tackle some of the most common hurdles Shopify merchants and e-commerce managers run into when putting an inventory control strategy into action.
This question comes up all the time. Think of it like this: Inventory management is the big-picture strategy. It’s the game plan. It answers questions like, "Which products should we carry?" "How much capital should we tie up in stock for the year?" and "How do we forecast seasonal demand?"
Inventory control, on the other hand, is the day-to-day execution of that game plan. It's the tactical, on-the-ground process of receiving shipments, tracking SKUs, managing warehouse locations, preventing stockouts, and counting what you actually have.
One is the "what" and "why." The other is the "how" and "right now." You can't have a winning strategy without solid execution, which is why control is so critical.
The old-school, once-a-year physical inventory count is a nightmare. It's disruptive, exhausting, and by the time you're done, the numbers are already out of date. That's why smart brands have moved to cycle counting.
Instead of a massive annual event, cycle counting means you check small sections of your inventory continuously. It's a much more manageable and effective approach. Here's a common breakdown:
This keeps your operations running smoothly and, more importantly, lets you catch discrepancies fast. You find and fix small errors before they snowball into major stockouts or costly overstock situations.
Key Insight: Consistency beats intensity. Frequent, smaller counts are the key to maintaining accurate data, which is the bedrock of any good inventory strategy. One small error in your system can ripple out, causing huge headaches down the road.
Yes. Absolutely. Thinking you can manage on a spreadsheet is one of the most common—and costly—mistakes new store owners make. It works fine for your first 50 orders, but it quickly becomes a liability.
That spreadsheet doesn't scale. Before you know it, it's riddled with tiny errors, leading you to oversell your most popular product or sink cash into a SKU that just isn't moving. You're flying blind.
Putting a real inventory system in place early isn't just about tracking stock; it's about building the habits and foundation for growth. It gives you clean, reliable data to see what’s truly profitable, so you can invest your limited capital with confidence. It’s about setting up the business you want to become, not just managing the one you have today.
AI isn't a crystal ball—it can't tell you that Jane Doe is going to buy a blue t-shirt next Tuesday. Where it truly shines is in forecasting overall demand with an accuracy that’s impossible to achieve manually.
It goes way beyond just looking at last month's sales. An AI-powered tool can analyze layers of data all at once: your entire sales history, subtle seasonal shifts, emerging market trends, and even the impact of upcoming holidays or promotions. It connects dots that a human would never see.
By finding these hidden patterns, it can generate a highly probable forecast of how many units you'll likely sell of each product. This lets you stop guessing and start ordering with confidence. You'll have enough to meet demand without tying up precious cash in inventory that's just going to sit on a shelf. It replaces gut feelings with data-driven probability, giving you a serious competitive edge.
Ready to stop guessing and start growing? Tociny.ai provides the actionable insights and AI-powered forecasting you need to master your inventory control. Move beyond messy spreadsheets and get the clarity to reduce stockouts, cut holding costs, and invest in your winning products.
Tociny is in private beta — we’re onboarding a few select stores right now.
Book a short call to get early access and exclusive insights.