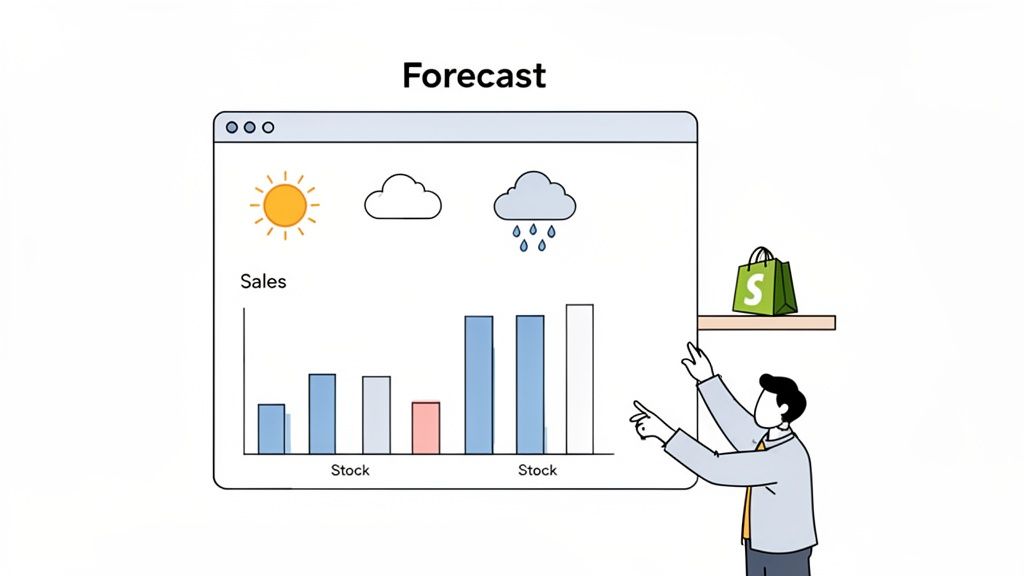
Demand forecasting is really just a fancy term for predicting what your customers will want to buy in the future. Think of it like a weather forecast for your Shopify store—it helps you see what's coming so you're not caught flat-footed. Getting this right is the secret to keeping your inventory lean, cutting down on waste, and just generally making smarter money moves.
Trying to run an e-commerce business without any forecasting is like driving blind. You might get by for a little while on pure luck, but sooner or later, you're going to hit a wall. For online stores, that wall usually looks like a warehouse overflowing with products nobody wants or, just as bad, a site full of "out of stock" signs on your bestsellers.
And getting this balance wrong isn't just an inconvenience; it costs you real money. Overstocking locks up your cash in dead inventory, racks up storage fees, and risks your products becoming obsolete. On the flip side, stockouts mean lost sales and frustrated customers who will probably just buy from your competitor instead.
The heart of great inventory management isn't just knowing what you have on the shelves. It’s about knowing what your customers will want—and when. That insight is what directly fuels your cash flow, your profits, and the overall health of your business.
Predicting customer demand isn't just a "nice-to-have" anymore. For modern retailers, it's mission-critical. After years of dealing with supply chain chaos and wild swings in consumer behavior, everyone is scrambling for a better way to see into the future. It’s a similar discipline to sales forecasting, but with a specific focus on inventory needs.
Recent trends tell the whole story. In a survey of over 300 brand executives, a whopping 77% ranked demand planning tools as their top priority for investment—the highest that figure has been in four years. This isn't just hype; it's a direct response to market volatility. The same report found that 91% of companies now see AI-driven insights as essential for growth. You can dig into these supply chain trends and see why everyone is so focused on this in a detailed report on demand planning priorities.
Solid forecasting fundamentally changes how you operate. You stop reacting to inventory fires and start making confident, data-backed decisions. It’s the difference between guessing and knowing. For a closer look at how this fits into the bigger picture, check out our guide on what demand planning entails.
The best part? Powerful forecasting tools are no longer just for the big guys. Modern AI platforms can sift through your sales history, market trends, and even the impact of your marketing promos to give you incredibly precise forecasts. It’s a capability that can give any Shopify merchant a serious competitive edge.
Choosing the right approach to demand forecasting is a lot like picking the right tool for a job. You wouldn't use a sledgehammer to hang a picture, right? In the same way, different business situations call for different forecasting models.
Let's break down the three fundamental approaches, starting with the simplest and working our way up to more complex, variable-driven predictions. Getting a handle on these is the first step toward building a reliable forecasting process for your Shopify store.
The most straightforward method, and often the best place to start, is Time-Series Analysis. Think of it as driving by looking in your rearview mirror—it uses your past sales data to map out your future trajectory. The core assumption here is that what happened before will, to some degree, happen again.
This model works by digging into your historical data to spot patterns over time. These patterns usually fall into a few key buckets:
For example, a Shopify store selling swimwear can look back and see that sales consistently spike every year from May to July. Based on that historical pattern, they can confidently predict a similar surge next summer and order their inventory accordingly. This method is powerful precisely because it’s based on your store’s actual performance.
A time-series forecast is fundamentally about letting your own history be your guide. It excels at capturing the natural rhythm of your business, making it a reliable starting point for any Shopify merchant.
The biggest blind spot? It struggles with sudden disruptions. A time-series model can’t predict the impact of a new competitor suddenly appearing or a marketing campaign that goes unexpectedly viral, simply because those events aren't in your past data.
While time-series models look backward, Causal Models look outward. This approach is more like a detective trying to understand the why behind your sales. It works by identifying the relationship between your demand and specific factors, both internal and external, that seem to influence it.
The whole goal is to build a model that shows how a change in one variable causes a change in your sales.
Some common variables you might look at include:
Imagine you run a big promotion and your sales jump by 30%. A causal model would help you quantify that relationship so you can repeat it. This makes it incredibly useful for planning marketing campaigns and actually understanding your return on investment. The main challenge is that it requires more data and a much deeper analysis to uncover these cause-and-effect connections accurately.
Sometimes, the most important data you need doesn't live in a spreadsheet. This is where Qualitative Methods come into play. This approach leans on human expertise, judgment, and opinion rather than historical numbers alone.
It’s absolutely essential when you're launching a brand-new product or expanding into a completely new market—situations where you have zero past sales data to work with.
This method gathers insights through:
For instance, if you’re launching an innovative new gadget on Shopify, you have no sales history. You’d have to rely on qualitative forecasting by surveying potential customers and getting feedback from industry bloggers to estimate what initial demand might look like. Sure, it's subjective and can be prone to bias, but this human-centric approach provides invaluable direction when hard data just isn't available.
Traditional forecasting models give you a decent baseline, but they're a lot like driving using only your rearview mirror. They’re great at showing you where you've been, but not so helpful for navigating the sudden turns ahead.
In e-commerce, those sudden turns are the norm. A viral TikTok video, a competitor's surprise flash sale, or an unexpected supply chain hiccup can make your historical data a pretty poor guide for what's coming next.
This is exactly where Artificial Intelligence (AI) and Machine Learning (ML) step in. Think of it as upgrading from a pocket calculator to a supercomputer. While a traditional model might juggle a few variables, an AI system can process thousands of data points in real time, spotting subtle patterns a human analyst would almost certainly miss.
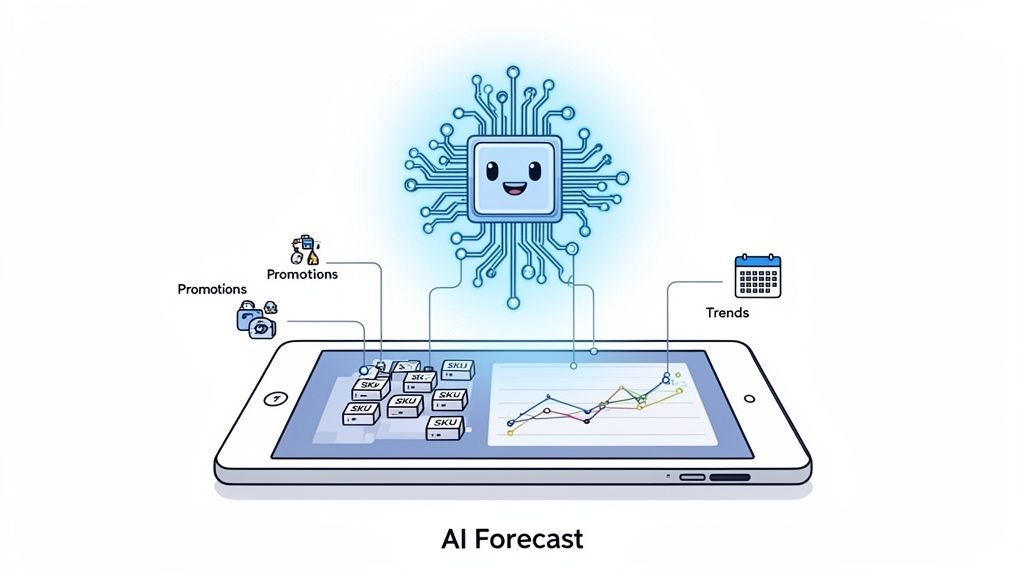
An AI-powered demand forecast acts like a tireless data scientist working exclusively for your store. It goes way beyond just looking at last year's sales figures. Instead, it pulls together a massive amount of information to understand the complex web of factors that actually drive customer behavior.
An AI model can analyze all of this at once:
By connecting these dots, AI builds a much richer and more dynamic picture of future demand. It can predict that a specific style of running shoe will spike in sales not just because it's spring, but because a popular fitness influencer mentioned it and a competitor is out of stock in a similar model. That’s a level of insight traditional methods just can’t offer.
To really grasp the difference, it helps to see the two approaches side-by-side. Traditional methods have their place, but AI and ML are built for the speed and complexity of modern e-commerce.
| Feature | Traditional Methods | AI and ML Forecasting |
|---|---|---|
| Data Inputs | Primarily historical sales data. | Historical sales, promotions, web traffic, market trends, weather. |
| Adaptability | Static; requires manual updates to change. | Dynamic; learns and adjusts automatically to new data. |
| Complexity Handling | Limited to a few variables (e.g., time, seasonality). | Can analyze thousands of interconnected variables simultaneously. |
| Accuracy | Good for stable products, poor for volatile ones. | Higher accuracy, especially for new products or volatile demand. |
| Speed | Can be slow and manual to build and update models. | Fast, real-time analysis and continuous model refinement. |
The takeaway is clear: while traditional forecasting looks backward, AI looks forward, constantly learning and adapting to give you a more accurate picture of what's to come.
Maybe the biggest advantage of using AI in forecasting is its ability to learn and adapt on its own. Traditional models are static. You build them with past data, and they stay that way until you manually update them. An ML model, on the other hand, is built to evolve.
When a sudden surge in demand hits, the model doesn't just record it. It analyzes the contributing factors and refines its future predictions. This self-correcting loop makes AI forecasting incredibly resilient to the market volatility that's just a part of life in e-commerce.
AI doesn't just give you a forecast; it gives you a living, breathing prediction that gets smarter over time. It fine-tunes its own logic with every new sale, every marketing campaign, and every shift in the market.
This adaptability is fueling a massive shift in the industry. The demand planning solutions market is projected to shoot past $6.8 billion by 2028, and nearly 90% of supply chain executives are planning major tech upgrades to handle global disruptions.
With global e-commerce sales hitting $6.3 trillion, the pressure to avoid stockouts—which cost retailers a staggering $1.1 trillion every year—has never been higher. AI-powered systems tackle this challenge head-on by ingesting historical data, market signals, and economic trends to forecast with incredible precision. You can get more details about this explosive growth in demand planning systems and what it means for the industry.
Not long ago, this kind of analytical power was only available to huge corporations with their own data science teams. Today, platforms like Tociny.ai are making AI-driven demand forecasting a reality for Shopify merchants of all sizes.
You no longer need a degree in statistics to benefit from sophisticated modeling. These tools handle the heavy lifting, turning complex data into clear, actionable recommendations. They empower you to make smarter inventory buys, optimize your marketing spend, and ultimately run a more profitable and efficient business. The result is a powerful competitive edge built not on guesswork, but on intelligent, forward-looking data.
Think of accurate demand forecasting like baking a cake—the final result is only as good as the ingredients you put in. For Shopify merchants, those ingredients are your data. A reliable forecast doesn't just materialize out of thin air; it's built on a solid foundation of clean, relevant, and comprehensive information.
The old saying "garbage in, garbage out" has never been more true. You could have the most advanced AI on the planet, but if you feed it incomplete or messy data, you'll get unreliable predictions. Period. To build a forecast you can actually trust, you have to start by gathering the right data points from both inside and outside your business.
The most powerful data for forecasting is already sitting inside your Shopify store. This internal information tells the story of your business—the historical context and specific details that form the backbone of any prediction. Start by pulling these essentials together.
Your core data sources should include:
Think of your sales history as the story of your business. Each data point is a chapter that explains how your customers have behaved in the past. Your job is to collect these chapters so an AI can read the story and help you write the next one.
While your internal data shows what happened within your business, external data provides crucial context about the world outside it. Modern AI forecasting models can analyze these outside signals to add another layer of precision, helping you get ahead of market shifts before they even happen.
This is where AI really flexes its muscles, connecting dots that would be impossible for a human to see. Consider pulling in these external data points:
So, you've gathered your data and generated a forecast. How do you know if it's any good? The final piece of the data puzzle is tracking your performance with key metrics. This closes the loop, allowing you to evaluate your accuracy and constantly get better.
Start by tracking these two fundamental metrics:
1 - Forecast Error. If you forecasted 100 units and sold 90, your error is 10%, making your accuracy 90%. Simple as that.By consistently collecting the right data and measuring your results, you turn demand forecasting from a guessing game into a strategic, data-driven process that powers smarter business decisions.
Knowing you need to forecast demand is one thing. Actually doing it is another beast entirely. For a lot of Shopify merchants, the idea of setting up a forecasting system feels like a huge, overly technical project. But it doesn't have to be that way.
The journey from pure guesswork to data-driven inventory planning is a totally manageable process. When you break it down into clear, actionable steps, you can start tapping into the power of forecasting without getting overwhelmed. Think of this as your roadmap, guiding you from setting clear goals all the way to weaving these new insights into your day-to-day operations.
Before you even think about opening a spreadsheet or signing up for software, you need to get crystal clear on what you’re trying to achieve. A fuzzy goal like "improve inventory" is a recipe for failure. You need specific, measurable targets that will act as the blueprint for your entire forecasting strategy.
Start by asking yourself: what are my biggest inventory headaches right now? Are you constantly sold out of your bestsellers, leaving money on the table? Or is your warehouse overflowing with slow-moving products that are tying up precious cash?
Your goals should look more like this:
These clear objectives become your North Star, making sure every single step you take is pushing you toward a real business outcome.
With your goals locked in, it’s time to gather your raw materials—your data. As we’ve talked about, accurate forecasting is built on a foundation of clean, comprehensive information. Don't stress about having perfect data from day one; just focus on pulling together the essentials.
Start by gathering your core internal data points. This means getting all your historical sales data (down to the SKU level) in one place, having a real-time view of your current inventory levels, and documenting your past and future promotional calendars. This initial dataset is the bedrock of your very first forecast.
The process is all about taking what you know and enriching it with outside signals to make an educated guess about the future.
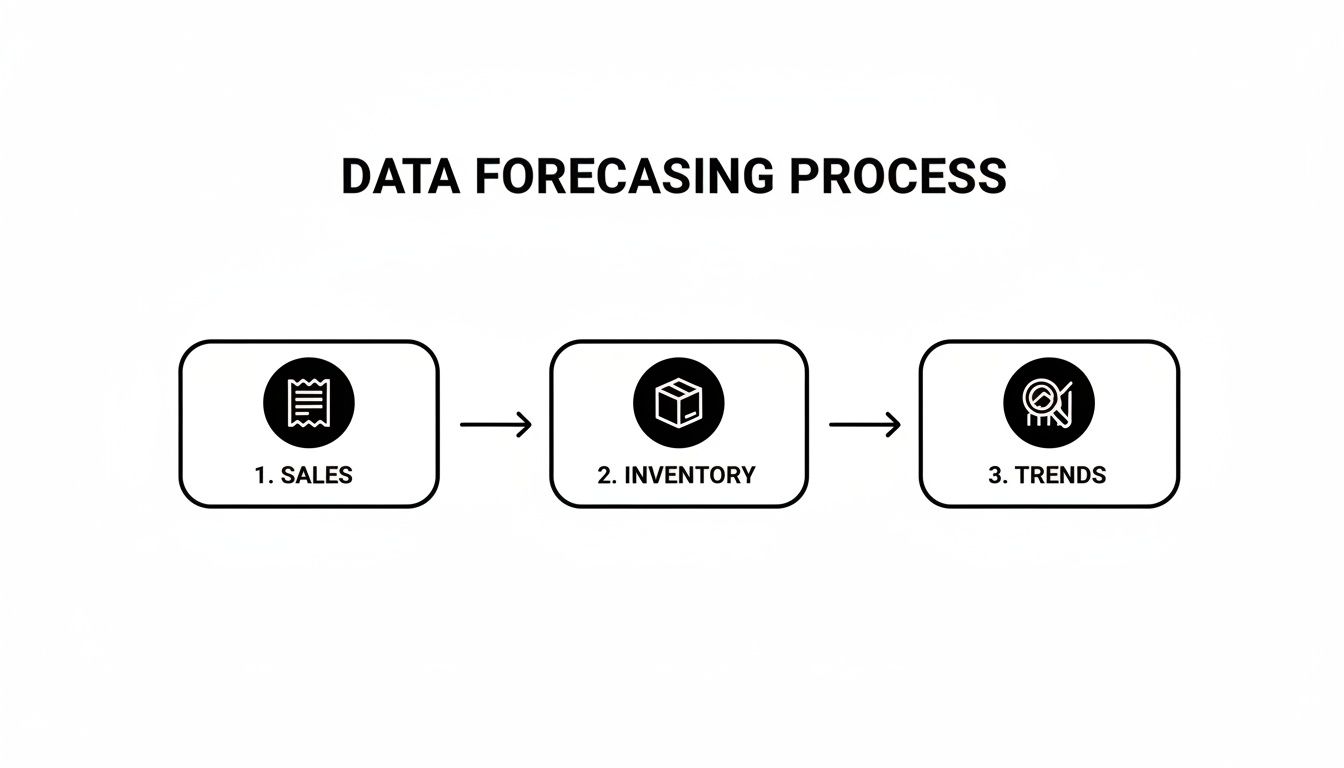
This diagram shows how a forecasting system pulls in historical performance (sales, inventory) and layers in external factors (like market trends) to generate a much smarter prediction.
Your forecasting toolkit can be anything from a simple spreadsheet to a powerful AI platform. The right choice comes down to your store's size, complexity, and the goals you set back in step one.
The key is not to overcomplicate it. Pick a tool that fits where you are today but has the room to grow with you tomorrow.
Alright, time to make it happen. Start small. Pick a single product line—ideally one with a good amount of sales history—and run your first forecast. This initial run isn't about getting a perfect number; it’s about learning the process and getting a feel for it.
Once you have your forecast, the real work begins. Compare what you predicted would happen with what actually happened.
Key Insight: Your first forecast will almost certainly be wrong. And that’s okay. The goal isn't instant perfection. It's about continuous improvement. Every forecast is a chance to learn, tweak your data, adjust your model, and get a little bit closer to the truth.
Calculate your Forecast Accuracy and Mean Absolute Percentage Error (MAPE). These metrics give you a hard number, a baseline to measure your improvement against over time. Look at where the forecast was off. Was it a surprise flash sale you forgot to account for? A new trend that popped up out of nowhere? This analysis is what will make your next forecast that much better.
A forecast is completely useless if it just sits on a dashboard. The final, and most crucial, step is to plug these insights directly into your business decisions. Use your forecast to guide your purchase orders, plan your marketing calendar, and optimize your cash flow.
And remember, this isn't a "set it and forget it" task. Great demand forecasting is a continuous loop: forecast, analyze, iterate, repeat. Set up a regular rhythm—maybe weekly or bi-weekly—to review your forecast accuracy and make adjustments. Over time, this iterative process will build an incredibly reliable and strategic asset for your Shopify business, finally shifting your operations from reactive to proactive.
Alright, let's move from the "what" to the "how." Great demand forecasting isn't about finding a single magic number; it's a discipline that blends smart analysis with practical, on-the-ground action. Think of it less like a one-time project and more like building a new muscle for your business.
By weaving these habits into your operations, you'll build a more resilient, responsive, and profitable Shopify store. It all starts with a clear focus and a commitment to getting a little better each week.
Trying to forecast every single SKU in your catalog right out of the gate is a surefire way to get overwhelmed. Don't boil the ocean. Instead, apply the classic 80/20 rule to your inventory.
This approach is often called ABC analysis, and it's a game-changer for focusing your energy where it counts. You simply categorize your products:
Nail your forecasts for the A-Items first. Getting these right makes the biggest dent in your bottom line with the least amount of initial headache.
Your demand forecast doesn't live on an island. A killer marketing campaign can send demand through the roof, just as a supplier delay can grind sales to a halt. Real success comes from breaking down the walls between your marketing, sales, and operations teams.
When marketing plans a flash sale, operations needs a heads-up to ensure there's enough stock. When operations hears a whisper of a supplier delay, marketing needs to know so they can pump the brakes on promos. This creates a unified game plan where everyone is reading from the same playbook, ensuring your forecasts reflect the whole business—not just a few isolated data points.
Let's be real: even the most sophisticated AI-powered forecast is still a highly educated guess. It’s a powerful guide, not a crystal ball. The market is messy and unpredictable, and no model can see the future with 100% clarity.
The true value of a demand forecast isn't its ability to be perfectly correct. It’s the power it gives you to make significantly better decisions than you could with guesswork alone, reducing uncertainty and minimizing risk.
Use your forecasts to inform your purchase orders, but always build in a buffer with safety stock for your most critical items. The goal isn't perfection; it's continuous improvement. To get deeper into the metrics that matter, check out our guide on improving demand forecast accuracy.
Finally, remember that demand forecasting isn’t a "set it and forget it" task. It's a living, breathing cycle of planning, measuring, and refining.
Set up a regular meeting—weekly or bi-weekly—to compare your forecasted numbers against what actually sold. Dig into the wins and the misses. Why was the forecast off for that one SKU? Was it an unexpected mention on social media? Did a competitor run a huge sale? This constant feedback loop is what makes your forecasting model smarter and more reliable over time, turning it into a genuine competitive edge for your store.
Getting into demand forecasting always kicks up a few questions. The key is getting straight, practical answers that help you build confidence and actually use your data to make a difference for your Shopify store. Let's dig into some of the most common questions we hear from merchants just starting out.
For most e-commerce brands, a weekly or bi-weekly review cycle is the sweet spot. This hits the right balance—it's frequent enough to catch short-term trends and the impact of your latest promotion, but not so often that it becomes a huge administrative chore.
Think of it like checking your GPS on a road trip. You don't stare at it every second, but you glance down regularly to make sure you’re on the right track and can adjust if you see a traffic jam ahead.
A forecast is a living document, not a static report. Regular updates ensure your inventory decisions are based on the most current market realities, preventing you from operating on outdated information.
If you wait too long between updates, say forecasting only quarterly, you’re leaving yourself wide open to sudden market shifts and missed opportunities. A consistent rhythm is what keeps you agile.
The single biggest mistake in demand forecasting is relying only on past sales data. Your sales history is absolutely a crucial piece of the puzzle, but treating it as the only piece ignores the future you are actively trying to create.
For instance, a simple forecast looking only at past sales will completely miss things like:
Good forecasting is a blend of historical data and forward-looking intelligence.
Absolutely not. You can get started with forecasting today using a simple spreadsheet. If you have a small store with a handful of products, manually tracking sales and building basic models is a fantastic way to learn the fundamentals.
But as your business grows, that manual approach quickly becomes a bottleneck. Spreadsheets are notorious for hidden errors and just can't handle large datasets or complex variables very well. An automated platform becomes essential when you're managing hundreds of SKUs, need to factor in external data, and require higher accuracy to scale your business without chaos.
Ready to move beyond spreadsheets and make smarter inventory decisions? Tociny.ai uses AI to deliver clear, actionable demand forecasts built for Shopify merchants. Get early access and see how we can help you reduce stockouts and grow your profits.
Tociny is in private beta — we’re onboarding a few select stores right now.
Book a short call to get early access and exclusive insights.