
Inventory holding cost is the total price you pay for storing unsold inventory. It’s a sneaky, often-ignored metric that can quietly eat away at your profits. This isn't just about the rent for your warehouse space; it covers everything from the cash tied up in your stock, to the labor, insurance, and the ever-present risk of your products becoming obsolete.
Think of your warehouse less as a storage facility and more like a high-end hotel for your products. Every single item on your shelves is a guest, and each day it stays, it runs up a tab. That daily tab includes charges for its "room" (shelf space), insurance, security, and more. This "hotel bill" is your inventory holding cost, and for many direct-to-consumer (D2C) brands, it’s a silent killer, draining cash reserves and tanking profits.
This isn't some abstract accounting term; it's a real, tangible threat to your business's financial health. Every dollar you have locked up in inventory that isn't moving is a dollar you can't put toward marketing, new product development, or just growing the business. In the current economic climate, with operational costs on the rise and margins getting squeezed, getting a handle on these expenses is a matter of survival.
The old rules of thumb just don't cut it anymore. For years, the industry standard for holding costs was somewhere in the ballpark of 20-30% of your inventory's total value. But recent economic shifts have sent that number climbing—a lot.
For direct-to-consumer and Shopify brands, the real cost of holding inventory has reached unprecedented levels. Carrying costs now range from 22% to 41% of total inventory value annually, a dramatic shift reflecting fundamental changes in supply chain economics. Discover more insights about the true cost of inventory on Branvas.com.
That spike means a huge chunk of your capital is being burned just by letting products sit on a shelf. The longer an item goes unsold, the more it costs you, steadily chipping away at the profit you hoped to make when you finally sell it.
Let's put that into perspective. If you're sitting on $100,000 worth of inventory, you could be shelling out up to $41,000 a year just for the privilege of storing it. That's a massive expense that could be fueling activities that actually grow your business. This reality should create a clear sense of urgency for any D2C brand.
Mastering your inventory holding costs is about more than just running a clearance sale to get rid of old stock. It demands a smarter, more strategic approach to:
Ignoring these hidden costs is like trying to fill a bucket with a hole in it. No matter how much revenue you pour in, your profits will just keep draining away. Before we get into the nitty-gritty of calculations and reduction strategies, it’s absolutely critical to see these costs for what they are: a direct and immediate threat to your bottom line.
To really get a grip on your inventory holding costs, you have to break them down. It’s not just one big, vague expense.
Think of it like a "Product Hotel" bill. Every single item sitting on your shelves is a guest, and their final bill is a combination of four distinct charges that quietly add up over time. Understanding these four components is the first step toward actually managing them.
This concept map shows a bird's-eye view of how these costs directly eat into your profits and tie up your cash, creating a sense of urgency.
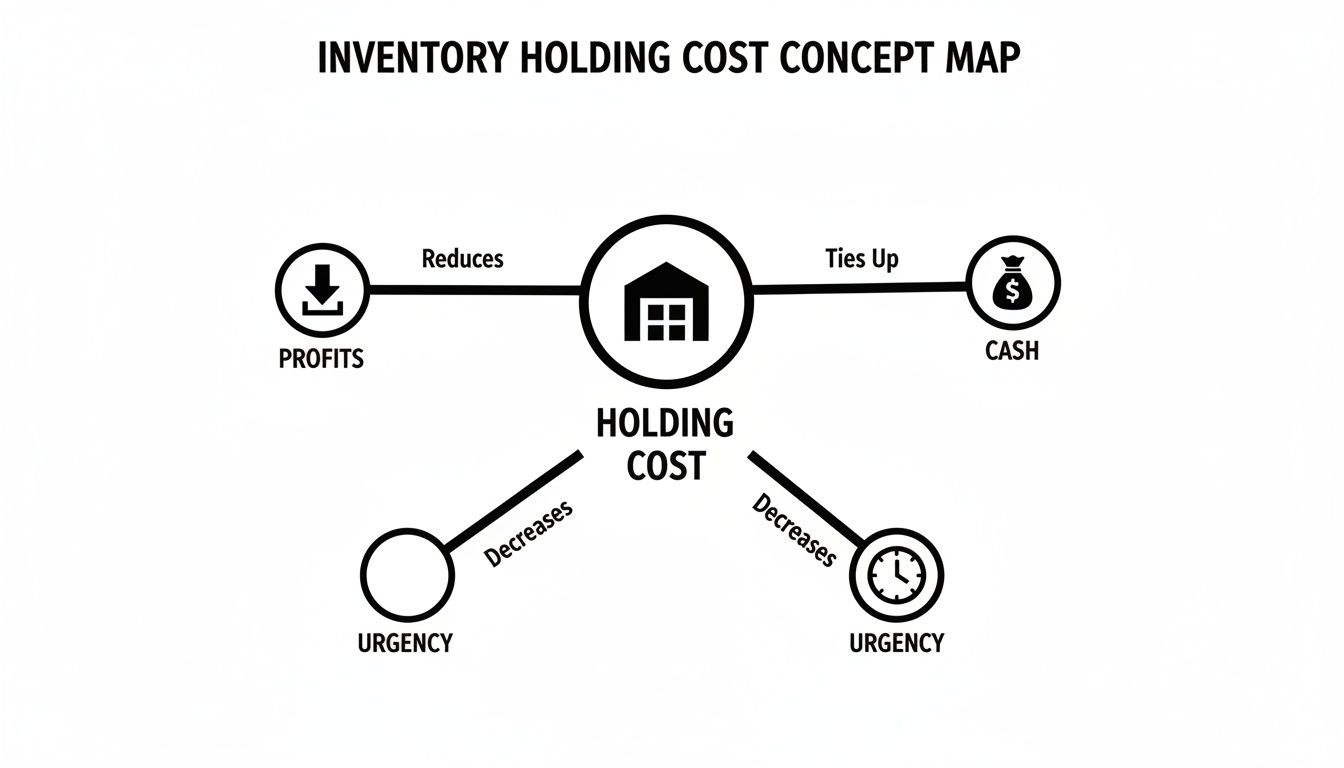
As you can see, letting these costs run unchecked is a direct drain on the financial health and agility of your business. Let’s unpack the four key components that make up your total holding cost.
Your total holding cost is a blend of four distinct categories. While the exact mix varies, understanding each one helps you spot where your money is really going.
| Cost Component | What It Includes | Typical % of Inventory Value | Example for a D2C Brand |
|---|---|---|---|
| Capital Costs | The opportunity cost of having cash tied up in inventory instead of being invested elsewhere. | 8-15% | Money spent on unsold sneakers could have been used for a new marketing campaign. |
| Storage Costs | Direct expenses for the physical space your inventory occupies. | 2-5% | Monthly rent for the warehouse, plus utilities like electricity and heating. |
| Service Costs | Operational expenses for managing and handling the inventory. | 3-8% | Warehouse staff salaries, software subscriptions, and insurance premiums. |
| Risk & Obsolescence | Costs associated with inventory losing value over time. | 5-10% | Skincare products expiring, electronics becoming outdated, or items being damaged. |
Breaking it down this way makes a seemingly complex metric much easier to tackle. Now, let’s look at each one in more detail.
This is the big one—the most significant and, ironically, the most overlooked part of holding costs. Capital cost is the money you have tied up in the inventory itself. It's not just the purchase price; it's the opportunity cost of that cash.
Every dollar you've spent on products sitting in a warehouse is a dollar that isn't earning interest in a bank, funding a new marketing campaign, or being invested back into product development.
For example, if you have $50,000 tied up in unsold inventory, and you could have earned a conservative 5% return on that money elsewhere, your annual capital cost is $2,500. It's the silent price you pay for having your cash locked up in physical goods.
This component is the most tangible and easiest to wrap your head around. It’s the direct, out-of-pocket cost of the physical space your inventory occupies. In our "Product Hotel" analogy, this is the room rate. These expenses are consistent and predictable, but they add up fast.
Storage costs cover all the direct expenses of your space, including: * Warehouse Rent: The monthly or annual bill for your storage facility. * Utilities: Electricity for lighting and climate control, which can be especially high for perishable or sensitive goods. * Insurance: Premiums to protect your inventory against fire, theft, or damage. * Property Taxes: If you own the warehouse, this is a direct tax tied to storage.
While these costs are relatively fixed month-to-month, they scale up as you hold more inventory, eventually forcing you to lease more space or a bigger facility.
Beyond just paying for the space, you have to actively manage the products within it. Inventory service costs are the "housekeeping and admin fees" of your hotel—all the operational expenses required to handle, track, and secure your stock.
These costs are directly tied to the people and systems that keep your inventory organized and ready to ship.
Service costs cover the human and technological elements of inventory management. This includes the salaries for warehouse staff, the cost of inventory management software like an ERP or WMS, and expenses for equipment like forklifts or barcode scanners.
Think about it: the time your team spends on cycle counts, receiving shipments from suppliers, and picking and packing orders all falls under this category. Better organization and more efficient systems can directly cut down these service-related expenses.
The final component covers the unpredictable but inevitable "unforeseen charges" that come with holding physical products. Unlike cash, inventory is a depreciating asset. The longer it sits, the higher the risk that it will lose some or all of its value.
These risks are a major driver of your total holding cost and come in several forms: * Shrinkage: The polite term for inventory that vanishes due to theft, administrative errors, or fraud. Even a small shrinkage rate of 1-2% can have a massive impact on your bottom line. * Damage: Products get dropped, crushed, or broken during handling or storage, rendering them unsellable. * Obsolescence: This is a huge risk, especially in fast-moving industries like fashion or consumer electronics. It's the cost of products becoming outdated or irrelevant before they can be sold. Think last season's colors or an older phone model. * Spoilage: For brands in the food, beverage, or wellness sectors, this is the cost of products hitting their expiration date before a sale.
Together, these four components—Capital, Storage, Service, and Risk—give you the complete picture of your true inventory holding cost. By breaking it down, you can finally see which areas are bleeding cash and start developing targeted strategies to bring them under control.
Knowing the what is one thing, but turning that theory into a hard number for your business is where the real magic happens. Calculating your holding cost pulls back the curtain on where your money is actually going, giving you a powerful KPI to track over time. Without it, you're flying blind, clueless as to how much profit is being quietly drained by stock that's just sitting there.
There are a couple of ways to tackle this. You can use a straightforward percentage formula for a quick snapshot, or you can roll up your sleeves with a more detailed component-based method for a much deeper, more actionable analysis. We'll walk through both, using a practical example to make the numbers feel real.
For a quick, high-level view, you can calculate your holding cost as a percentage of your total inventory value. This is a great way to get a baseline or if you're just starting to measure this metric.
The formula is pretty simple: Holding Cost % = (Sum of All Holding Costs / Total Inventory Value) x 100
This percentage tells you exactly how many cents you spend to hold every dollar's worth of inventory for a full year. For instance, a holding cost of 25% means you spend $0.25 for every dollar of inventory you store annually.
Think about it this way: if your holding cost is 30% and you have $200,000 in average inventory, you're spending $60,000 a year just to keep that product on your shelves. That's a powerful way to frame the financial impact.
While it's a useful benchmark, this approach depends on you having an accurate total for your holding costs. For a more precise figure, you really need to break it down.
To get a truly accurate picture, you need to add up the four core components: capital, storage, service, and risk. Let's walk through an example with "Wellness Co.," a fictional Shopify store that sells supplements.
Wellness Co.'s Key Numbers: * Average Inventory Value: $150,000 * Capital Cost Rate (WACC): 8% * Annual Warehouse Rent & Utilities: $12,000 * Annual Insurance & Taxes: $3,000 * Annual Warehouse Labor Costs: $25,000 * Annual Software Subscriptions (WMS): $2,500 * Annual Cost of Shrinkage & Damage: $4,500 * Annual Cost of Expired/Obsolete Stock: $7,500
Now, let's crunch the numbers for each piece of the puzzle.
Capital Costs: This is the opportunity cost of having your cash tied up in products.
Storage Costs: These are the direct expenses for your physical warehouse space.
Service Costs: This covers the people and tech needed to manage the inventory. For a clearer view of stock management efficiency, you can also explore our guide on the Days Inventory Outstanding formula.
Risk Costs: This is where you account for all the inventory that loses its value one way or another.
With these individual figures, Wellness Co. can now calculate its total holding cost and find its holding cost percentage.
Total Annual Holding Cost: $12,000 + $15,000 + $27,500 + $12,000 = $66,500
Holding Cost Percentage: ($66,500 / $150,000) x 100 = 44.3%
Ouch. A 44.3% holding cost is a huge eye-opener. The detailed breakdown immediately shows Wellness Co. that their service costs are the biggest drain on their bottom line, giving them a clear target for optimization. By running this analysis, you transform an abstract concept into a concrete, actionable number you can use to make much smarter decisions for your business.
Okay, so you know your inventory holding cost. That’s step one. But the real magic happens when you start actively shrinking that number.
Bringing that cost down frees up cash, fattens your profit margins, and builds a more resilient business. These aren't just costs you have to eat; they are numbers you can control. Forget complex theories. These are practical, battle-tested methods that DTC brands can put into action right away to see a real impact on the bottom line.
Let's break down five powerful ways to start cutting your carrying costs today.
Guesswork is the arch-nemesis of an efficient warehouse. When you order based on a gut feeling or what sold well last year, you’re setting yourself up to have way too much of one product and not nearly enough of another. Modern demand forecasting is your way out of the guessing game and into data-driven decisions.
By analyzing sales trends, seasonality, and what’s happening in the market, you can predict what your customers will want with way more accuracy. This lets you order stock closer to when you’ll actually need it, slashing the time it spends just sitting on your shelves racking up costs.
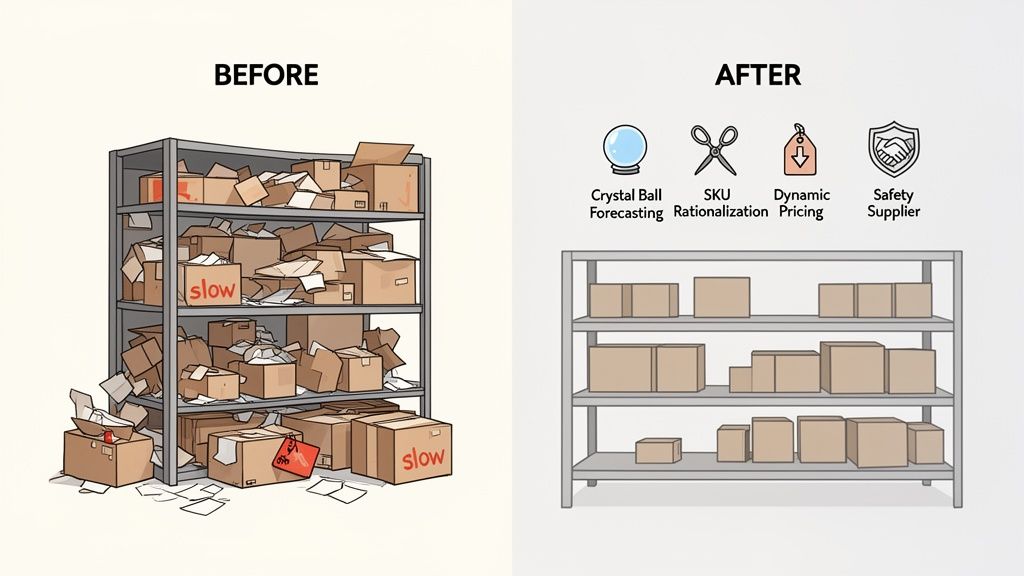
Before: A fashion brand orders 1,000 units of a new jacket based on last year’s hit. But trends changed. They're left with 400 unsold jackets at the end of the season, with all that cash and warehouse space tied up.
After: Using forecasting that spots the new trend, they order a smarter 650 units. They sell out completely, maximizing profit and dodging the high carrying cost of dead stock.
Let's be honest: not all of your products are stars. SKU rationalization is the process of taking a hard, honest look at your catalog to weed out the underperformers. These are the "zombie" SKUs—they don't sell often, but they keep sucking up valuable shelf space, capital, and mental energy.
This strategy forces you to ask tough questions about every single item. Is it really pulling its weight in revenue? Is its margin high enough to justify the cost of keeping it around? You'll often find that by cutting the bottom 10-20% of your SKUs, you can free up a surprising amount of cash and simplify your entire operation. It's crucial to understand and apply effective inventory management strategies to make this process work.
When you inevitably end up with too much of something, letting it sit is the most expensive mistake you can make. Dynamic pricing isn’t about brand-killing fire sales; it’s about strategically adjusting prices to spark demand and clear out those slow-movers before they become a real problem.
Think of it as giving those products a little nudge. You can try more subtle tactics like: * Bundles: Pair a slow-mover with a bestseller for a small, attractive discount. * Flash Sales: Create a sense of urgency with a limited-time offer on specific items. * Tiered Discounts: Give customers a small price break for buying more than one.
The goal here is to turn that stagnant inventory back into cash—fast. You need to stop the daily bleed from holding costs. The small hit you might take on the margin is almost always less than what it would cost to store that product for another six months.
Safety stock is your buffer. It’s the extra inventory you keep on hand to guard against a sudden spike in demand or a delay from your supplier. It’s absolutely necessary, but having too much of it is a massive, hidden driver of high carrying costs.
The trick is to find that sweet spot—the point where you minimize stockout risk without tying up a ton of cash. This isn't a single number for your whole catalog. Your safety stock should be dynamic, tailored to each product's sales velocity and your supplier's reliability. A hot-selling item from a super-reliable supplier needs very little safety stock. An item with unpredictable demand or a long lead time? That one needs a bigger cushion. Calculating this correctly for each SKU stops you from over-ordering "just in case."
And, of course, finding the ideal order size is just as important, a concept we dive deep into in our guide to the Economic Order Quantity.
Your suppliers have a direct line to your holding costs. Long, unpredictable lead times force you to hold more safety stock to cover the uncertainty. But if you work with your suppliers as partners, you can often shorten those lead times and make them more reliable.
Consider a few moves: * Share Your Forecasts: Giving your suppliers a peek at your expected demand helps them plan their own production. The result? Faster, more reliable fulfillment for you. * Negotiate Smaller, More Frequent Orders: Instead of one massive quarterly order, see if you can switch to smaller monthly or even bi-weekly shipments. This dramatically reduces how much inventory you're holding at any one time. * Explore Local Sourcing: It isn't always the cheapest option upfront, but local suppliers can often offer much shorter lead times, allowing you to run a leaner, more agile inventory model.
Let's be honest: trying to implement strategies like demand forecasting and SKU rationalization by hand is a beast of a task. It means endless hours buried in spreadsheets, wrestling with complex formulas, and accepting a high risk of human error. This is where modern technology comes in, transforming these painful manual chores into a powerful, automated advantage.
AI-powered analytics platforms, which once felt like a luxury reserved for massive corporations, are now essential tools for any ambitious D2C brand. They do the heavy lifting, freeing up your team to shift from mind-numbing data crunching to making sharp, intelligent decisions. This pivot is critical for getting your inventory holding costs under control and unlocking capital for growth.
At its core, an AI inventory tool connects directly to your sales data and unleashes powerful algorithms to find insights that are nearly impossible to spot manually. You stop reacting to what happened last month and start proactively planning for what's coming next.
This is what a modern, AI-driven inventory dashboard looks like—offering clear, actionable insights at a glance.
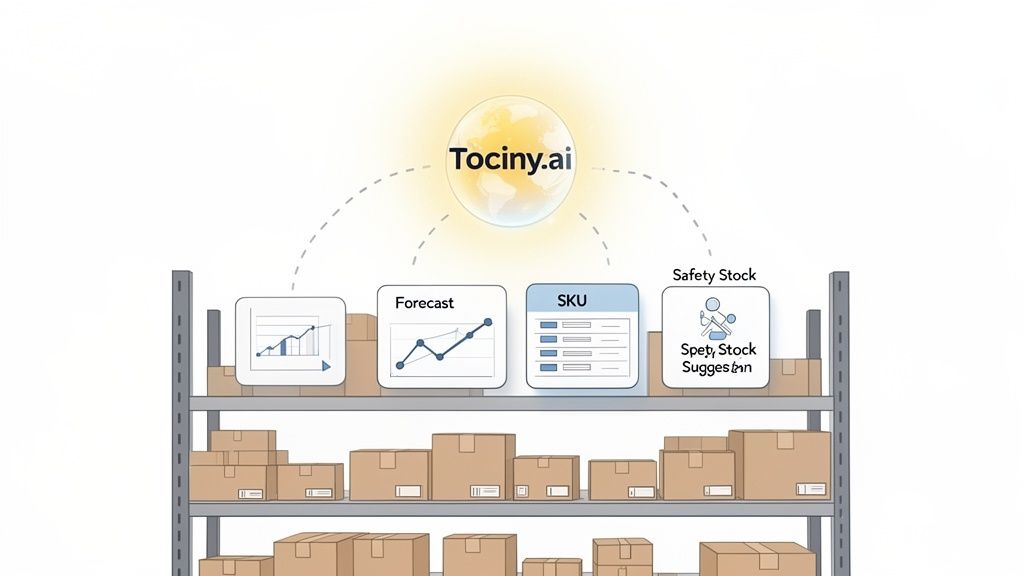
The platform immediately brings key performance indicators, sales forecasts, and stock level predictions to the surface, cutting through the complexity.
This shift from manual to automated inventory management is why the global market for these solutions is booming. It's projected to grow at a compound annual rate of 24.90% through 2033, which shows just how urgent this problem is for businesses. The results speak for themselves: retailers using AI-powered systems often slash their stockout rates to below 5%, a massive improvement over the industry average of 9.5%.
An AI platform like Tociny.ai is designed to tackle the strategies we've discussed, making them not just easier to implement but far more effective. Think of it as an intelligent co-pilot for your inventory planning.
Here’s a practical look at how it connects to the solutions:
Automated Demand Forecasting: The platform’s forecasting engine chews through historical sales, seasonality, and market trends to predict future demand with stunning accuracy. This gets you out of the guessing game and into data-driven purchasing, so you can order the right amount of stock just when you need it. (You can dive deeper into how this works in our article on AI-powered demand forecasting.)
Data-Driven SKU Rationalization: AI dashboards automatically flag your slow-moving "zombie" products—the ones tying up cash and warehouse space. By ranking SKUs on profitability and sales velocity, the system gives you clear, unapologetic recommendations on which products to cut, promote, or re-evaluate.
Precise Safety Stock Tuning: Instead of applying a generic, one-size-fits-all buffer, AI algorithms calculate the optimal safety stock for each individual product. They weigh factors like supplier lead times, sales volatility, and your service level targets to recommend pinpoint adjustments. This minimizes overstock without ever putting you at risk of a stockout.
By automating these critical functions, AI strips the emotion and guesswork out of inventory decisions. It ensures every choice is backed by solid data, which leads directly to lower inventory holding costs and healthier cash flow.
The effectiveness of AI in inventory optimization is supercharged when platforms can tap into real-time data for AI agents. This constant flow of information allows the system to adapt on the fly to sudden market shifts.
Ultimately, adopting an AI tool like Tociny.ai isn’t about replacing your team—it’s about empowering them. It liberates them from tedious manual work and arms them with the data-driven insights needed to make the smarter, more profitable decisions that will push your business forward.
Even after breaking down the strategies and formulas, it’s completely normal to have a few lingering questions as you get ready to tackle your own inventory holding costs. We hear the same ones come up time and again from merchants, so we’ve put together some straight-to-the-point answers.
Think of this as your final checklist before you dive in. Once you’re clear on these points, you’ll be in a great position to build a more efficient, profitable D2C business.
There’s no magic number here. The old benchmark of 20-30% is frankly a bit outdated. In today's economy, with rising costs across the board, many D2C brands are seeing their actual rates creep higher.
Instead of chasing a universal figure, the best move is to benchmark against yourself. First, get a clear picture of your current holding cost percentage. From there, set a realistic goal to chip away at it—maybe a 10-15% reduction over the next quarter.
Your ideal rate also really depends on what you sell. * High-Margin Goods: If you’re selling products like cosmetics or high-end apparel, you can likely stomach a slightly higher holding cost. The healthy profit you make on each sale gives you more breathing room. * Low-Margin Goods: For items like consumer electronics or basic home goods, every percentage point matters. Keeping your holding cost below 25% is often critical to protecting those slim profit margins.
For most D2C brands, running the numbers quarterly hits the sweet spot. It’s frequent enough to catch problems before they spiral, see if new strategies (like that big SKU cleanup you just did) are working, and make adjustments without drowning your team in spreadsheets.
But this isn't a one-size-fits-all rule. If you're in a fast-moving industry like fashion where trends change in a blink, a monthly calculation is probably smarter. It gives you the agility to react quickly. Likewise, if your brand is in a high-growth spurt, more frequent check-ins will help you stay ahead of the curve. The most important thing is just to be consistent.
Yes, absolutely. It sounds strange, but an extremely low inventory holding cost can be a huge red flag. It’s often a sign that you’re understocking products just to save a few bucks on storage and capital. That might look good on a P&L statement, but it’s a dangerous game to play.
An unusually low holding cost is often a symptom of an overly lean inventory, which can lead directly to frequent stockouts. This results in lost sales, frustrated customers, and long-term damage to your brand's reputation.
The goal isn't to get your holding costs to zero. It's to find that perfect balance—the sweet spot where you minimize expenses without ever letting a customer down. This is where modern tools that help you dial in your safety stock levels become so powerful; they help you strike that equilibrium without the guesswork.
For Shopify merchants today, rising operational costs have made finding this balance more crucial than ever. A typical breakdown includes storage (8-15% of inventory value), handling (2-5%), insurance (2-5%), shrinkage (1-3%), and the big one, capital costs (6-12%). As you can see from this analysis on the real cost of inventory, trying to slash these to the bone is just asking for stockouts.
Stop guessing and start optimizing. Tociny.ai replaces spreadsheet chaos with clear, AI-driven recommendations to help you master your inventory, slash holding costs, and unlock capital for growth. Get early access and see what data-driven inventory planning can do for your Shopify store. Join our private beta at Tociny.ai.
Tociny is in private beta — we’re onboarding a few select stores right now.
Book a short call to get early access and exclusive insights.