Bottom-up forecasting is a bit like calculating a building's total weight by adding up every single brick, one by one, instead of just guessing from an airplane flying overhead. It’s a powerful method where you predict future demand by starting small—at the individual product level—and building your way up to a total forecast. This granular, SKU-level approach gives you a startlingly realistic picture of what's to come.

If you've ever tried planning your inventory based on broad market trends or just last year's total sales figures, you’ve used a top-down approach. It's fast, sure, but it often misses the mark, leaving you with a mountain of one product and a frustrating stockout of another.
Bottom-up forecasting completely flips that model on its head. It’s a methodology that builds a forecast from the ground up, starting at the most detailed level possible: the individual SKU (Stock Keeping Unit). Instead of starting with a big-picture sales goal and working your way down, you begin with the actual building blocks of your business.
This means you’re diving into the historical sales data, current trends, and planned promotions for each specific product in your catalog. You start asking the right kind of questions:
By answering these questions for every single item, you create a series of mini-forecasts that are firmly grounded in reality. These individual predictions are then aggregated—or "rolled up"—to create bigger-picture forecasts for product categories, sales channels, and eventually, your entire store.
The real magic of bottom-up forecasting lies in its precision. Because it starts with real, historical product performance data, it provides a much clearer and more reliable picture of future customer demand. This is especially true for Shopify brands with diverse catalogs, where every item has its own unique seasonal patterns, sales velocity, and customer base.
To help you see the difference clearly, let's break down the two approaches.
This table lays out the fundamental differences between the two methods, highlighting why starting from the ground up often leads to better, more actionable insights.
| Attribute | Top-Down Forecasting (The Airplane View) | Bottom-Up Forecasting (The Brick-by-Brick View) |
|---|---|---|
| Starting Point | High-level market data or total revenue goals. | Individual product (SKU) level sales history. |
| Process Flow | Breaks down a total forecast into smaller parts. | Aggregates individual SKU forecasts into a total. |
| Data Required | Macroeconomic trends, market share, total sales. | Detailed sales history per SKU, seasonality, promos. |
| Accuracy | Lower. Prone to error at the product level. | Higher. More precise and reliable for inventory. |
| Best For | High-level strategic planning, setting annual goals. | Operational planning, inventory management, purchasing. |
| Effort | Less time-consuming, requires less detailed data. | More intensive, requires granular data and analysis. |
As you can see, while the top-down view has its place for setting broad company goals, the bottom-up approach is where the rubber meets the road for day-to-day operations. For dynamic e-commerce businesses, this detailed method has proven to be a significantly more accurate way to project revenue compared to traditional top-down strategies. Its strength comes from its foundation in hard data, not broad assumptions. You can find more details on how this applies to sales forecasting in this guide from Incentx.com.
A top-down forecast might tell you that your total apparel sales will grow by 10% next quarter. A bottom-up forecast will tell you that t-shirt sales will likely decline by 5%, but your new line of jackets is projected to grow by 40%, driving that overall increase.
This level of detail is a complete game-changer for inventory management. It empowers you to make smarter purchasing decisions, slash the carrying costs tied to overstock, and minimize the revenue you lose from frustrating stockouts. You're no longer just guessing; you're building a strategic plan, brick by brick.
Building a solid bottom-up forecast isn't about getting lost in complex math. It's more like following a recipe—a structured process of piecing together small, accurate predictions to create a powerful, big-picture view. By gathering the right ingredients and following the steps in order, you can cook up a dependable forecast that truly guides your inventory decisions.
This method breaks the whole process down into a clear, manageable roadmap. We’ll walk through each stage, from grabbing your initial data to rolling up your final numbers, using practical examples to make every concept stick.
Your forecast is only as strong as the data it’s built on. The first, and most critical, step is to gather the essential building blocks—the raw numbers that tell the real story of your products. This isn't about high-level trends; it’s about getting your hands dirty with the performance of each individual item.
For a successful bottom-up model, you’ll need to collect:
This initial data-gathering phase sets the stage for everything else. Clean, detailed, and organized data is non-negotiable if you want a forecast you can actually trust.
With your data in hand, the real work begins. The goal here is to create a mini-forecast for every single SKU in your catalog. This is where you shift from just looking at past data to actually predicting future performance, one product at a time.
Imagine you're forecasting demand for that "Summer-Themed T-Shirt." You'd analyze its historical sales to spot key patterns. Does it sell best from May to August? That’s its seasonality. Did sales double during last year's July 4th sale? That's the promotional uplift.
For each SKU, you have to weigh several factors:
For example, your analysis might predict you'll sell 150 units of the summer t-shirt in June, peaking at 250 units in July with a planned promotion, before tapering off to 100 units in August. You then repeat this precise, focused process for every other product in your store. You can dive deeper into different approaches in our guide to demand forecast methods.
Once you have a forecast for every individual SKU, the final step is to "roll up" these numbers to see the bigger picture. This aggregation phase is what transforms your collection of micro-forecasts into a comprehensive, store-wide demand plan.
The process itself is simple but incredibly powerful. You just systematically combine the individual SKU forecasts to understand demand at progressively higher levels.
Aggregation in Action: 1. SKU-Level: Forecast for "Summer T-Shirt - Blue, L" + "Summer T-Shirt - Red, M"... 2. Product-Level: ...equals the total forecast for the "Summer T-Shirt" product line. 3. Category-Level: Total "Summer T-Shirt" forecast + "Linen Shorts" forecast + "Sun Hat" forecast equals the "Summer Apparel" category forecast. 4. Store-Level: The sum of all your category forecasts gives you the total demand projection for your entire store.
This bottom-up aggregation provides a powerful reality check. Because the final number is built from validated, product-level data, it’s far more reliable than a top-down guess. It gives you a clear, defensible view of future demand—not just as a single number, but as a detailed map showing you exactly where that demand will come from. You're building your inventory plan with precision, one brick at a time.
Think of a great forecast like a gourmet recipe—its success hinges entirely on the quality of the ingredients. If you start with subpar components, the final dish will be a letdown, no matter how skilled the chef. It’s the same with demand planning; your predictions are only as good as the data they’re built on.
This is exactly where many businesses stumble. They feed their forecasting models incomplete or messy information and then wonder why the results are all over the map. The old "garbage in, garbage out" saying has never been more true. To build a solid forecast, you first need to gather clean, comprehensive data that tells the real story of your store’s performance.
This is the stage where you stop looking at just sales numbers and start digging into the why behind them.
Before you can predict what’s next, you have to truly understand what already happened. Your historical sales data is a goldmine of insights, but you need to do a little digging to separate predictable patterns from one-off events that can throw everything off.
Start by looking for these key elements:
An accurate forecast correctly predicts the 80% sales lift from your annual Black Friday sale (a pattern) but ignores the 300% one-day spike caused by a viral TikTok video (an anomaly).
This flow diagram breaks down how raw data gets turned into a refined, actionable forecast.
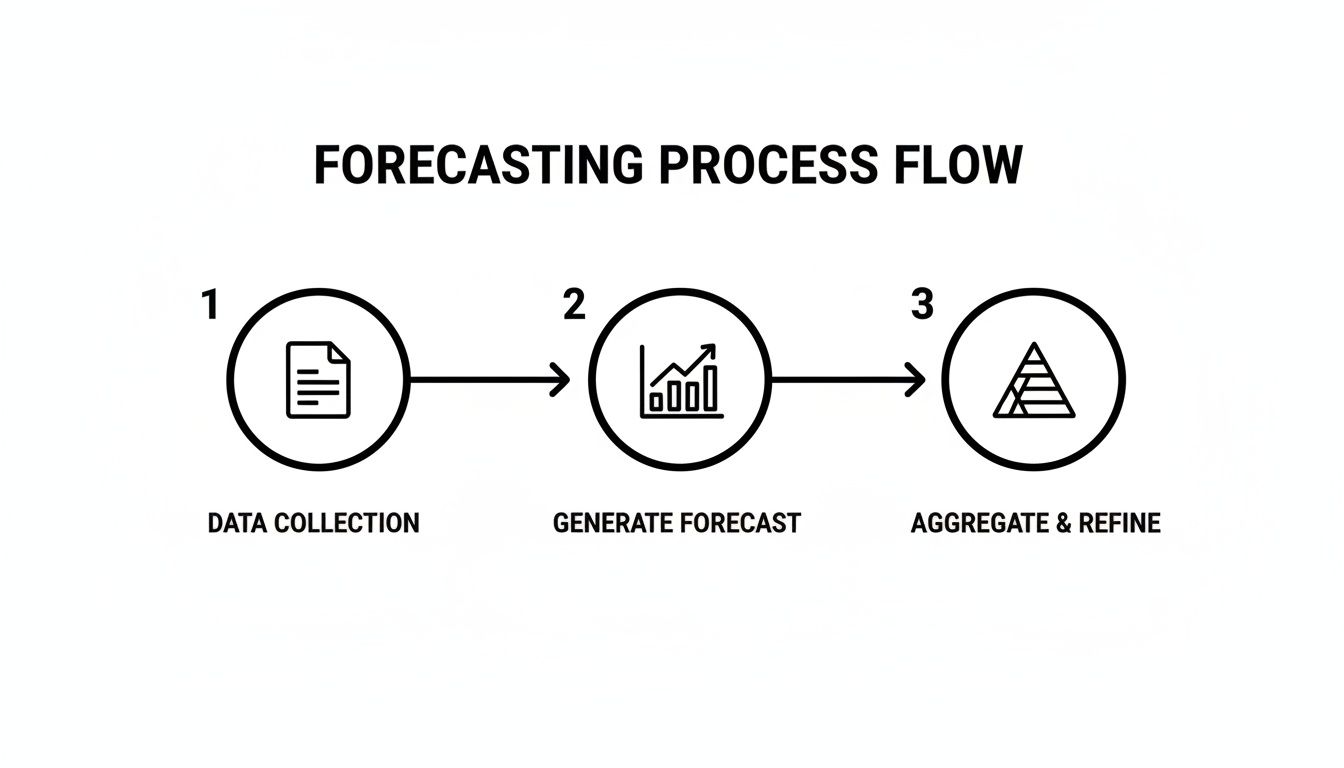
As you can see, the process starts with clean data, moves to generating the initial SKU-level forecasts, and finishes by rolling those details up into a comprehensive plan.
Historical data gives you the foundation, but a truly great forecast also has to factor in your own plans and outside forces. The things you plan to do to boost sales, and the things you can't control, need to be layered onto your baseline prediction.
Think about these critical variables:
For Shopify merchants and D2C brands, this granular approach is pure gold. It accounts for the specific performance of individual sales channels and product lines, so you're not just slapping a generic, market-wide growth rate on everything. You can get more insights on this in this analysis on sales forecasting.
Let’s be honest: no forecast is perfect. Unpredictable things happen, from a sudden surge in demand to a shipping delay from your supplier. That’s where safety stock comes in. It’s the extra inventory you keep on hand just in case, acting as a buffer against uncertainty.
Figuring out the right amount is a balancing act. Too little, and you risk frustrating customers with stockouts. Too much, and you’re tying up precious cash in inventory that's just sitting there. A smart way to start is by looking at your historical forecast accuracy and your supplier lead time variability. This simple step turns a basic demand forecast into a robust inventory plan, giving you the resilience to handle the unexpected without killing your profitability.
Theory is great, but seeing a bottom up forecasting model in action really makes the concept click. Let’s follow a practical scenario with Jane, a Shopify store owner who runs a boutique home goods brand.
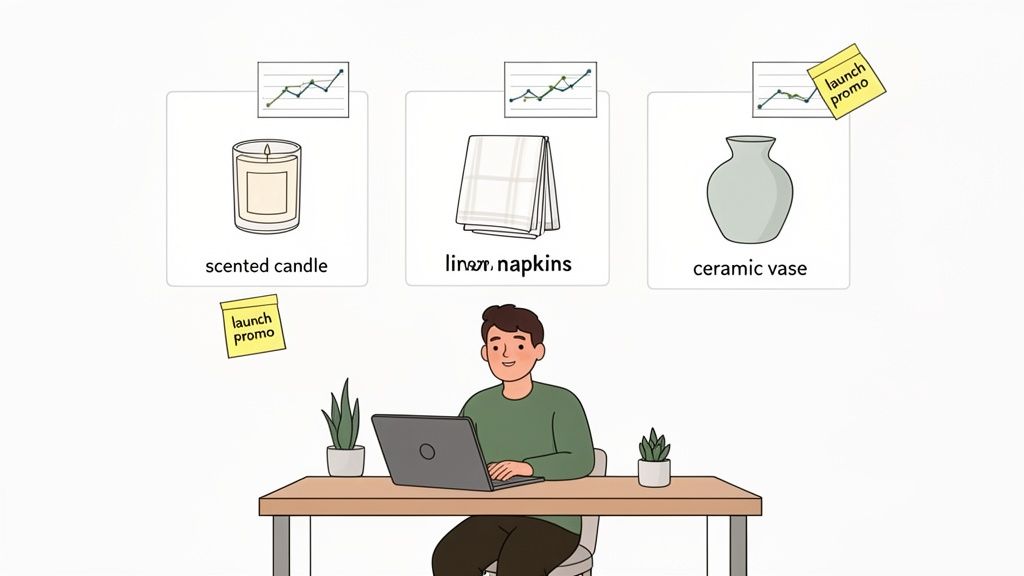
Jane is gearing up to launch a new "Coastal Living" collection with three brand-new SKUs. The big question is: how much inventory should she order? Since these products have zero sales history, a traditional forecast is off the table. This is the perfect job for a bottom-up approach.
Her new product lineup includes: * SKU 1: "Ocean Breeze" Scented Candle * SKU 2: "Sea Glass" Linen Napkins (Set of 4) * SKU 3: "Driftwood" Ceramic Vase
Instead of making a broad, top-level guess for the entire collection, Jane is going to build her forecast brick by brick, starting at the most detailed level she can.
With no historical data, Jane turns to the next best thing: similar products. She pulls up the numbers for her "Lavender Fields" candle, which sold 150 units in its first month after a similar marketing push last year. She pencils this in as a conservative baseline for her new "Ocean Breeze" candle.
Next, the linen napkins. Her existing "Harvest Gold" napkin set is a steady seller, moving about 80 units per month. But the new "Sea Glass" color is really on-trend right now. Jane projects a modest 10% lift, forecasting 88 units for the launch month.
The ceramic vase is a totally new category for her store, which makes things trickier. Here, she has to lean on market research and what she sees competitors doing. She lands on a cautious estimate of 50 units. This shows how bottom-up forecasting can adapt even when you don't have a perfect one-to-one comparison.
Key Takeaway: For new products, a bottom-up forecast starts with informed assumptions based on similar SKUs, market data, and planned marketing efforts. The goal isn't perfection, but a realistic starting point.
Jane’s launch plan includes a "15% off" promotion for the first two weeks. She knows from past sales that this kind of offer typically gives her a sales lift of around 40%. So, she applies this uplift only to her baseline forecast for the first half of the month.
This is a critical step. A top-down model might completely gloss over a specific, SKU-level detail like this. But the bottom-up approach lets her bake that known variable directly into her calculations for each individual product. This is the same principle behind tools like a Peak Season Staffing Calculator—using granular data to build a more accurate big-picture plan.
With her individual SKU projections ready, Jane can now add them all up. The math is simple, combining her baseline numbers with the promotional lift. She now has a total forecast for the "Coastal Living" collection's launch month.
What she ends up with is a detailed, defensible inventory plan built from the ground up. This method’s power lies in its ability to handle all these little details, ensuring the final forecast reflects reality, not just wishful thinking.
Once the collection launches and sales data starts rolling in, Jane can track the real-time performance of each SKU. If the "Ocean Breeze" candle flies off the shelves faster than expected, she can quickly adjust its forecast and place a reorder. This prevents a stockout on a hot item without forcing her to overcorrect her entire inventory plan.
This is exactly how bottom up forecasting gives e-commerce brands the agility and precision they need to manage inventory in the real world.
Even the most carefully planned bottom up forecasting strategy can go off the rails. It’s a powerful method, but its greatest strength—its reliance on granular, SKU-level data—can also become a weakness if you’re not careful. Knowing the common mistakes is the first step to building a forecasting process that’s not just accurate, but resilient.
Think of it like navigating a ship. A single faulty instrument or one misread of the currents can send you miles off course. In the same way, small, seemingly minor errors in your forecasting can compound over time, leading to massive inventory headaches and financial strain. The key is knowing what these hazards look like and having a plan to steer clear.
One of the most common mistakes is confusing a temporary sales spike with a permanent new trend. Let's say an influencer gives your product an unexpected shout-out, or you run a one-day flash sale. Both can create a huge, but temporary, surge in orders. If you treat that anomaly as your new baseline, you’ll end up over-ordering inventory that will just gather dust.
The solution? Smooth out the data. Instead of reacting to daily sales figures, use rolling averages—like a 7-day or 30-day average—to get a clearer picture of the real demand trend. This simple step helps you tell the difference between a genuine shift in customer behavior and a fleeting, one-off event.
Pro Tip: Tag unusual sales events directly in your data. If you know a specific day’s spike was driven by a non-repeatable event like a warehouse clearance sale, you can exclude it from future calculations to keep your forecast grounded in reality.
The old saying "garbage in, garbage out" is the first rule of forecasting. If your sales history is riddled with errors, missing entries, or inconsistent product names, your forecast will be unreliable before you even start. This is the quickest way to lose faith in the whole process.
To fix this, you have to commit to regular data hygiene. Before you even think about building a model, take the time to clean up your data. This means:
A clean dataset is the non-negotiable foundation for any successful bottom up forecasting model.
Your store doesn't operate in a vacuum. A forecast built only on your own historical data is vulnerable to being blindsided by the outside world. A competitor launching a major promotion, a sudden shift in consumer spending habits, or even unexpected supply chain disruptions can completely throw off your sales.
You have to stay informed about what’s happening beyond your own four walls. Keep tabs on key competitors, read industry news, and actually talk to your suppliers about potential delays. By breaking down your operations into their fundamental parts and using product-level data, you gain the ability to defend every assumption in your forecast with real evidence. This fundamentals-first approach helps you anticipate revenue changes and understand why variances are happening.
By watching out for these common pitfalls, you can build a far more robust and reliable forecasting system. The goal isn't just to predict the future, but to truly understand the variables that shape it. To learn more about evaluating how well your predictions are performing, check out our guide on how to calculate your forecast accuracy formula.
Let's be honest: building a manual bottom up forecast in a spreadsheet is a Herculean task. If you're managing hundreds—or even dozens—of SKUs, the process isn't just time-consuming; it's a minefield of potential errors. One broken formula or a copy-paste mistake can throw your entire inventory plan off course, leading to expensive stockouts or dead stock.
This is exactly where modern technology steps in. AI-powered tools are built to take this entire manual headache off your plate, turning a dreaded chore into a genuine strategic advantage. Instead of you wrangling the data, these platforms connect to your sources, crunch the numbers, and spot complex patterns that a spreadsheet could never hope to catch.
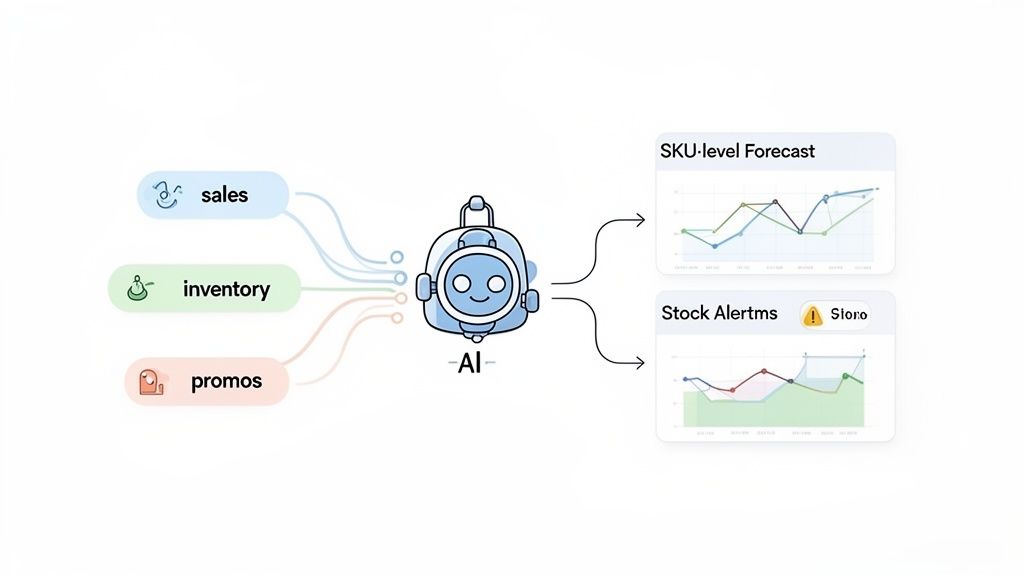
For Shopify merchants, a tool like Tociny.ai is like having an expert inventory analyst on your team, working around the clock. It plugs directly into your Shopify store, automatically pulling in all the critical data—from historical sales for every single SKU to current inventory levels and upcoming promotions. No more late nights exporting CSV files and cleaning up messy data.
Once connected, Tociny.ai's adaptive AI engine gets to work. It immediately starts analyzing your unique sales history to generate precise, SKU-level forecasts that automatically account for seasonality, trends, and the impact of your marketing efforts.
The real goal of AI isn't to replace your intuition; it's to supercharge it. By handling the heavy data lifting, AI frees you up to focus on the big picture—like planning your next killer product launch or marketing campaign.
Features like sales forecast charts and stock level predictions distill mountains of data into simple, actionable visuals. You no longer have to guess how many units of that best-selling t-shirt to order. The system gives you clear, data-driven recommendations to keep your inventory perfectly balanced.
So, how does this all compare to the old spreadsheet grind? The difference is night and day.
| Task | Manual Forecasting (Spreadsheets) | AI-Powered Forecasting (Tociny.ai) |
|---|---|---|
| Data Collection | Hours of manual exporting and data cleaning from Shopify and other sources. | Automated. Direct integration pulls SKU-level sales, inventory, and promo data. |
| Model Building | Complex, time-consuming formulas for each SKU. High risk of human error. | AI-driven. Automatically builds and refines models for seasonality and trends. |
| Forecast Updates | Requires completely re-running the entire process manually for new data. | Continuous. The AI model constantly adapts to new sales data for up-to-date accuracy. |
| Accuracy | Varies widely. Highly dependent on individual skill and prone to costly mistakes. | High. Algorithms identify deep patterns, leading to a 20-30% boost in accuracy. |
| Scalability | Becomes nearly impossible to manage as your product catalog grows. | Effortless. Scales from 100 to 10,000+ SKUs without any extra manual work. |
The benefits of an AI-driven approach boil down to three things: you save an incredible amount of time, you drastically improve your forecast accuracy, and you empower anyone on your team to make smart inventory decisions.
To get the most out of these tools, it helps to understand the core concepts behind them. Diving into predictive analytics for ecommerce can give your Shopify store a powerful crystal ball for what’s coming next.
Ultimately, letting an AI handle the number-crunching allows you to graduate from reactive, "fire-fighting" inventory management to a proactive strategy built for growth. You can see how different tools stack up in our guide to the best demand forecasting software.
Even with the best game plan, jumping into a new forecasting method always brings up a few questions. Let's tackle the most common ones we hear from Shopify store owners so you can get started on the right foot.
In a perfect world, you'd have 12 to 24 months of sales history for every single SKU. That amount of data gives you a crystal-clear picture of your annual seasonal cycles and any underlying growth trends, which are the two pillars of a solid forecast.
But don't let a shorter history hold you back. If you only have 3 to 6 months of clean sales data, you can still build a very useful starting forecast. For brand-new products with no track record, a popular move is to use a similar "look-alike" product as a proxy. You can then fine-tune that initial guess as soon as the real sales data starts rolling in.
Absolutely. In fact, starting with a smaller product catalog is the ideal scenario. It's much easier to get the hang of the process when you're only managing a handful of SKUs, allowing you to perfect your technique without getting buried in spreadsheets.
When you nail forecasting for a few key products, you're not just getting better numbers—you're building a repeatable system. That mastery becomes a huge asset that scales right along with your business as you add more products down the road.
For most e-commerce brands, especially those with fast-moving products, you should be reviewing and updating your forecast weekly or bi-weekly. This rhythm keeps you nimble, letting you react quickly to the latest sales trends, the impact of a new marketing campaign, or any other sudden market shifts.
A forecast is a living document, not a "set it and forget it" report. Frequent updates ensure your inventory decisions are always guided by the freshest, most relevant data.
This regular check-in prevents you from getting blindsided by a sudden spike or dip in demand. It transforms your forecast from a static, one-time project into a dynamic tool that steers your business week in and week out.
Ready to stop guessing and start forecasting with precision? Tociny.ai connects to your Shopify store to automate SKU-level forecasting, saving you time and preventing costly stockouts. Get early access and see how AI can transform your inventory planning.
Tociny is in private beta — we’re onboarding a few select stores right now.
Book a short call to get early access and exclusive insights.