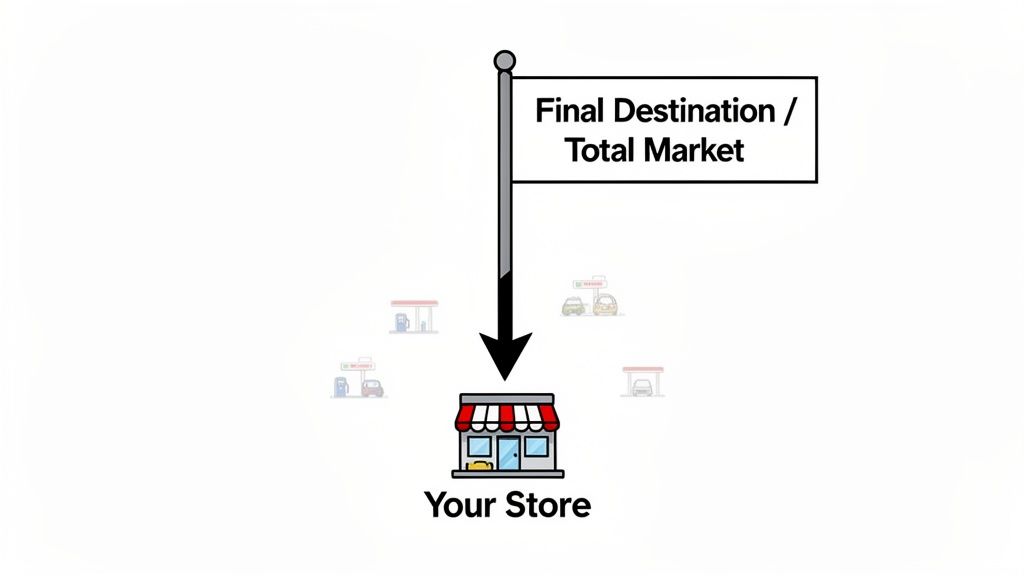
If you've ever planned a big cross-country road trip, you probably didn't start by mapping out every single gas station along the way. You picked the final destination first, then worked backward. That's the perfect way to think about top-down forecasting—it's a high-level, strategic approach to figuring out future sales by looking at the entire market first.
Top-down forecasting is a method that starts with the biggest possible number: the total market size for whatever you're selling. From there, you estimate what slice of that pie you can realistically claim—your market share—and then break that down into more specific targets for product lines, regions, or sales channels. Think of it as a "macro-to-micro" strategy that keeps your inventory and sales goals grounded in broad economic trends and the company's big-picture objectives.
This approach is the complete opposite of a granular, bottom-up forecast, which builds a prediction from the sales history of individual products. The real magic of starting from the top is the strategic clarity it provides, especially for direct-to-consumer (D2C) brands trying to find their footing or break into new markets.
The whole method works like a logical funnel. You begin with the Total Addressable Market (TAM)—the absolute largest revenue potential—and systematically narrow it down to a sales figure you can actually hit.
The main steps look something like this:
This process gives you a much-needed framework when you don't have detailed historical sales data to lean on, like when you're launching a new product or expanding into a new country. It tethers your ambitious goals to market realities. For a deeper dive, our guide on what is demand planning puts this into the broader strategic context.
For Shopify founders and ecommerce managers, top-down forecasting is a vital strategic tool. It shifts the conversation from, "How much did we sell last month?" to "How much could we sell next year?" That forward-looking perspective is crucial for setting annual budgets, securing investor funding, and making those big, scary inventory commitments.
A top-down forecast acts as a strategic North Star. It ensures that day-to-day operational decisions, like placing a purchase order, are directly tied to the company's long-term growth ambitions and market potential.
This isn't a new-fangled idea; major retailers have used this approach for decades to align their growth targets with the real world. Think about Amazon. Their revenue forecasting often starts with the Total Addressable Market for e-commerce, which is expected to blow past $5 trillion globally by 2026. By applying a market share assumption based on their dominant position, they project revenues that are then cascaded down to individual product categories. It's a perfect example of how starting big creates strategic alignment, even if it skims over some of the nitty-gritty details.
Of course, to make this work, you have to understand your own data. A good beginner's guide to Shopify analytics and reports will give you the foundational knowledge you need to check if your high-level assumptions actually make sense on the ground.
When you’re trying to predict your store's future, there are really two main ways to look at it: from the sky down or from the ground up.
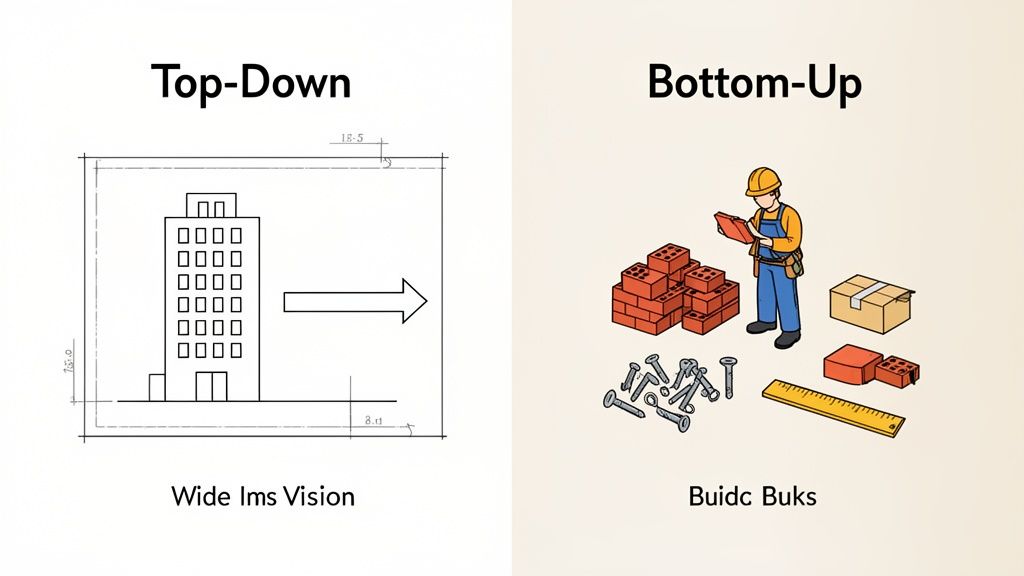
Think of it like building a house. Top-down forecasting is like the architect drawing up the master blueprint. It starts with the big, ambitious vision—the entire structure—and only then drills down into the details of each room.
On the other hand, bottom-up forecasting is like the builder on the ground, meticulously counting every single brick, nail, and two-by-four needed to build the foundation. It’s practical, tangible, and rooted in what’s right in front of you.
This isn't about picking a "winner." A great business needs both the architect's grand vision and the builder's on-the-ground precision. The trick is knowing which tool to pull out for which job.
The biggest win for a top-down forecast is its strategic focus. By starting with the total available market and your desired slice of it, you force yourself to think big. This naturally connects your inventory planning to your most important business goals, like hitting an annual revenue target or capturing 5% of a new market.
This high-level approach is your go-to in a few key situations:
But this bird's-eye view is also its biggest weakness. It can be overly optimistic and completely miss the nitty-gritty details on the ground, like a specific SKU that’s suddenly falling out of favor with your customers.
A bottom-up forecast is all about operational reality. It’s built from the ground up using the most reliable data you have: your own historical sales figures, SKU by SKU. This makes it incredibly good at creating accurate, short-term predictions for the products you’re already selling.
Here’s where it really shines:
The catch? A bottom-up forecast can be shortsighted. It’s chained to your past performance, so it can struggle to see bigger market shifts or grasp the potential of a bold new strategy. It tells you exactly where you've been, but it doesn't always show you where you could go.
To really nail down the differences, it helps to see them side-by-side. Here’s a quick breakdown of how these two approaches stack up for an ecommerce business.
| Attribute | Top Down Forecasting | Bottom Up Forecasting |
|---|---|---|
| Starting Point | Total market size and business goals | Historical sales data of individual SKUs |
| Best For | Strategic planning, new products, market entry | Operational inventory management, existing products |
| Time Horizon | Long-term (e.g., 1-3 years) | Short-term (e.g., 1-3 months) |
| Key Advantage | Aligns inventory with high-level strategy | Provides granular, data-driven precision |
| Primary Risk | Can be overly optimistic and miss details | Can be blind to big-picture market shifts |
As you can see, they serve very different purposes. One isn’t inherently better; they’re just different tools for different jobs.
The most resilient ecommerce brands don't choose one method over the other. Instead, they create a feedback loop: using a top-down forecast to set ambitious goals and a bottom-up forecast to validate them against operational reality.
Ultimately, a hybrid approach is where the magic happens. You might use a top-down forecast to set an ambitious annual sales goal. Then, you build a bottom-up forecast to see if your current product-level sales trajectory is even capable of getting you there.
If you find a gap between the two, you know exactly what you need to do: either adjust your strategy to close it or adjust your expectations to match reality.
Picking between a big-picture strategic forecast and a granular, SKU-level one isn't about which is "better." It's about knowing which tool to pull out of the toolbox for the job at hand. A top-down forecasting approach is your best bet in a few key situations—specifically when a bottom-up view is either impossible or just plain shortsighted.
Figuring out when to use it is the secret to making smarter, data-backed decisions that actually move the needle on growth. This method gives you a solid framework for navigating uncharted territory, helping you set a clear direction even when the day-to-day details are still a bit fuzzy.
This is the classic scenario for top-down forecasting. When you're rolling out something brand new, you have zero sales history. A bottom-up forecast is dead in the water before it even starts. You can't analyze data that doesn't exist.
This is where you have to look outward, not inward. Picture a sustainable swimwear brand gearing up to launch its first collection. The team can’t possibly predict sales for each specific bikini style and color. But what they can do is research the total market size for eco-friendly apparel, make an educated guess on their potential market share based on their brand and marketing spend, and then work backward to build a sales plan.
This approach flips the question from "How many did we sell last time?" to "How many could we realistically sell?" It’s a forward-looking mindset that’s absolutely crucial for innovation and growth.
Using this method sets a sensible ceiling on how much you should invest in inventory and gives you a data-backed story to tell stakeholders or investors. It grounds your big, ambitious launch in the reality of the market opportunity.
In the same vein, when you decide to take your brand international or target a completely different customer demographic, you’re essentially back at square one. Your sales history in the United States isn't going to be a perfect predictor of how you'll do in Germany.
A top-down forecast is the only logical solution here. It forces you to: * Analyze the new market's size and its unique economic pulse. * Scope out the local competition to estimate a viable slice of the pie you can capture. * Set initial inventory levels and sales targets tailored to the new region’s potential, not just a copy-paste of your past performance elsewhere.
This simple step prevents a lot of expensive headaches, like shipping a mountain of inventory to a smaller market or, just as bad, underestimating the demand in a bigger one and leaving sales on the table.
Top-down forecasting is also the natural starting point for annual financial planning. While your operations team is buried in the weeds of monthly and quarterly performance, the leadership team needs to be looking at the horizon, defining the big-picture vision for the year ahead.
It all starts with macro-level questions: How much is our overall market expected to grow? What’s our strategic goal for market share? What’s our target for annual revenue?
By starting with these high-level objectives, you create a clear destination. That destination can then be broken down into quarterly, monthly, and even channel-specific goals. This ensures that the more detailed, bottom-up planning done by the rest of the team aligns with the company’s mission.
In retail, this is a go-to strategy for massive sales events. A major chain planning for the holidays might start with macroeconomic indicators—like the projected $7 trillion in global e-commerce sales by 2026—and then slice that number down by region and product category. This bird's-eye view helps them predict demand for huge events like Black Friday or Singles' Day with far more confidence, so they can get their inventory and pricing strategies right. You can dive deeper into how major retailers use these tactics in this helpful glossary entry on DealHub.io.
A top-down forecast might sound a bit abstract, but actually putting one together is a pretty logical process. Think of this as your playbook for turning big-picture market data into a real, concrete sales plan for your ecommerce store.
By following these steps, you can build a solid strategic framework, even if you don't have years of your own sales history to lean on.
The process flow is especially useful for a few key business moves: launching a totally new product, expanding into a new market, or just setting your big annual goals.
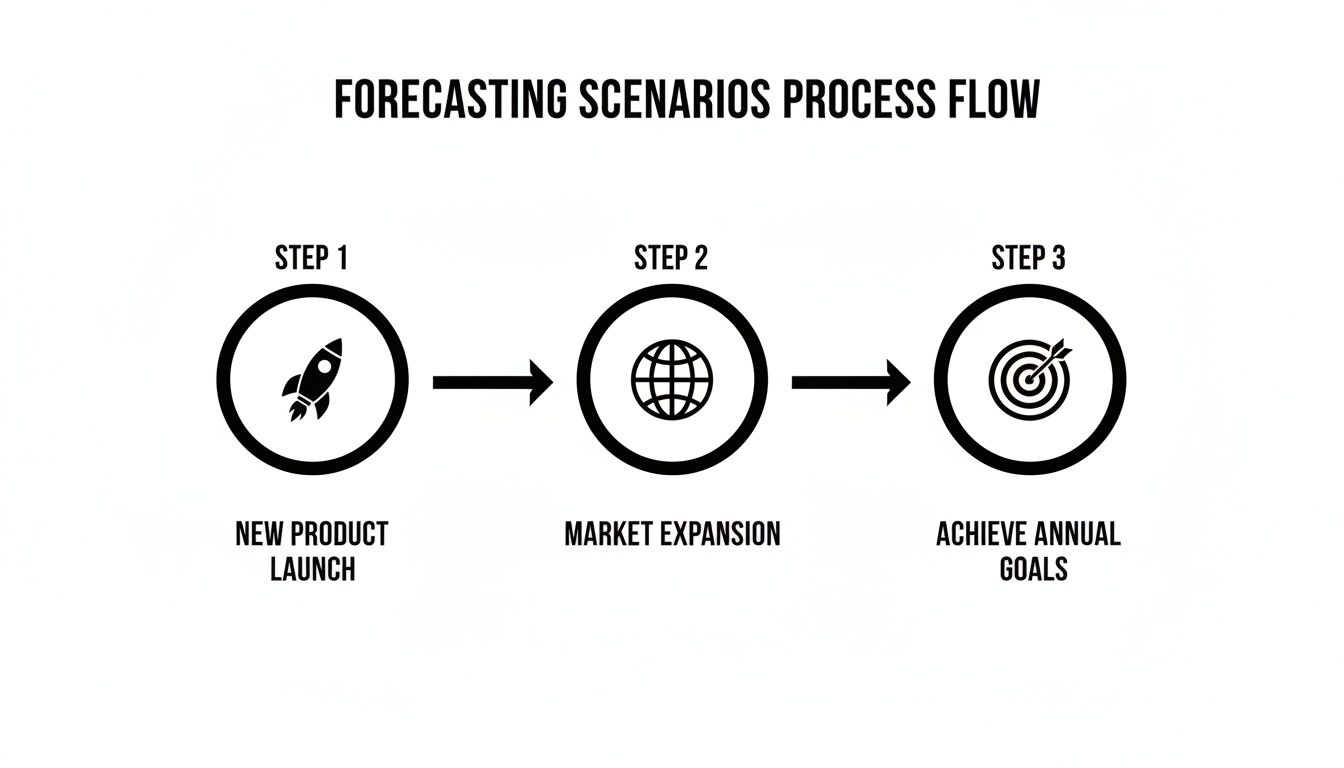
Each of these big moves requires you to understand the entire landscape first, which is exactly where top-down forecasting shines.
First things first: you need to figure out the size of the entire pizza before you can decide how big of a slice you can realistically eat. Your Total Addressable Market (TAM) represents the maximum possible revenue you could pocket if you somehow captured 100% of the market. This number is your ceiling.
So, where do you find this magic number? * Industry Reports: Big research firms like Statista, Gartner, and Nielsen are goldmines for market size data. * Government Stats: Agencies like the U.S. Census Bureau offer a ton of valuable (and free) economic data. * Trade Associations: Niche industry groups often do their own specific market research that you won’t find anywhere else.
Let's say you're launching a new D2C brand for organic dog food. You'd start by researching the total annual spending on premium pet food in your target country. That gives you a clear, data-backed number to start from.
Nobody captures 100% of a market, especially not overnight. The next step is to be brutally honest with yourself and estimate what percentage you can actually achieve. This is where you have to size up your brand strength, the competition, your marketing budget, and your distribution power.
A brand-new store might aim for a tiny sliver, maybe just 0.1%, in its first year. On the other hand, an established brand moving into a new category might confidently shoot for 1-2%.
TAM x Target Market Share = Initial Revenue Forecast
This simple formula is what grounds your ambitious goals in reality. It takes that massive market number and turns it into a sales target you can actually wrap your head around.
Now that you have a high-level revenue goal, you’ve got to chop it up into smaller, more manageable pieces. A $1 million annual target is intimidating, but a $250,000 quarterly goal feels much more actionable.
You can slice and dice your forecast in a few ways: * By Product Category: If you sell clothes, you could allocate the forecast across tops, bottoms, and accessories based on what you expect to be most popular. * By Sales Channel: Split the target between your Shopify store, your TikTok shop, and any wholesale partners you have. * By Time: The most common way is to break the annual forecast down into quarterly and then monthly targets. This makes tracking your progress a breeze.
Segmenting your forecast is what turns a big strategic vision into an operational roadmap your marketing and inventory teams can actually use day-to-day.
Markets are never static. Your forecast has to breathe, accounting for the predictable ups and downs and any bigger trends. Dig into historical market data to spot the seasonal peaks (like Black Friday) and valleys (like a mid-summer slump). A swimwear brand, for example, is obviously going to plan for a huge spike in spring and early summer.
You also have to look at the market's overall growth. Is your industry booming, shrinking, or just holding steady? You'll need to adjust your numbers to reflect that. If the premium pet food market is growing at 8% a year, your own forecast should probably reflect that nice tailwind.
As you build out your plan, knowing which numbers to look for is half the battle. Understanding the top metrics for forecasting can give you a much sharper picture and feed into your high-level predictions.
This last step is a crucial reality check. A top-down forecast gives you the strategic "what if," but you have to sanity-check it against whatever ground-level data you have. This is where top-down thinking meets a bottom-up approach.
Look at your own historical sales, even if the data is limited. Check your website's conversion rates and your marketing performance. Do your current operational numbers even remotely support the ambitious goals you just set?
If there’s a massive gap between your top-down goal and what your current metrics suggest is possible, that’s a red flag. It tells you that you either need to revise your strategic assumptions or figure out how to invest more resources to bridge that gap. This final validation step is what makes your forecast both ambitious and achievable.
And if you're curious about other ways to predict future sales, you might find our guide on different demand forecast methods helpful.
While top-down forecasting is a fantastic strategic tool, it’s not infallible. Its birds-eye-view nature means it has some serious blind spots that can lead to costly inventory mistakes if you aren’t careful. Treating a top-down number as gospel without checking it against reality is a recipe for overstock or, even worse, disappointing stockouts.
The good news is that understanding these potential weaknesses ahead of time allows you to use the model intelligently. By anticipating the common mistakes, you can build safeguards into your process and turn a good forecast into a great one.
This is the classic trap. It’s so easy to fall in love with an ambitious market share goal that just isn't grounded in reality. You look at a massive Total Addressable Market (TAM) and think, "Capturing just 1% should be a piece of cake!"
But this thinking often ignores the brutal intensity of competition, the real-world limits of your marketing budget, and the actual strength of your brand. An overly optimistic forecast leads directly to mountains of excess inventory that tie up your cash and demolish your profits.
How to Avoid It: Force yourself to create three distinct scenarios: a best-case, a worst-case, and a most-likely case. This simple exercise breaks you out of the echo chamber and forces a more critical look at your assumptions. It also gives you a range of potential outcomes, making your financial and inventory planning far more flexible and resilient.
A top-down forecast tends to paint the entire market with a single, broad brush. It can easily gloss over crucial differences in consumer behavior, purchasing power, and economic conditions from one region to another. A national forecast, for instance, might completely miss a local economic downturn in a key state, leading you to ship way too much inventory to an area where demand is actually cratering.
A forecast is only as good as the assumptions it's built on. If your high-level view ignores on-the-ground realities, it becomes a strategic liability instead of an asset.
How to Avoid It: Whenever you can, break your TAM down into smaller, more relevant chunks. Instead of one national forecast, create separate ones for your top three to five regions. You can even layer in regional economic data or look at Google Trends to get a more textured, realistic picture of where demand is truly heading.
Here’s a big one: a top-down forecast tells you what you could sell, but it says absolutely nothing about what you can actually get. It lives in a world where the practical constraints of your supply chain—like supplier lead times, production capacity, and shipping logistics—don't exist.
Setting a bold sales target is pointless if your suppliers can only deliver half the inventory you need to hit it. This misalignment is a classic cause of preventable stockouts, especially during your busiest seasons.
How to Avoid It: Talk to your team. Always validate your top-down forecast with your operations or supply chain managers. Share your projections with key suppliers to confirm they have the capacity to meet the demand you’re predicting. This one crucial conversation bridges the gap between your strategic goals and your operational reality, ensuring your forecast is not just ambitious but actually achievable.
A classic top down forecasting model is fantastic for setting the big-picture strategy. It tells you the size of the prize and what your high-level sales goals should be. But its greatest strength—that bird's-eye view—is also its biggest weakness: it lacks the granular, on-the-ground details. This is exactly where AI steps in to bridge the gap between ambitious financial targets and your day-to-day inventory reality.
Think of your top-down forecast as the grand blueprint for a skyscraper. It shows you how tall the building can be and its overall shape. AI is the team of engineers on every single floor, crunching real-time data to make sure each beam and support is perfectly placed. AI doesn't replace the blueprint; it makes it achievable.
Modern AI platforms, like Tociny.ai, go way beyond just looking at last year's sales. They plug directly into your Shopify data, processing thousands of data points to find patterns that are simply invisible to the human eye. This brings a completely new level of precision to your high-level plans.
Here’s how AI gets it done:
This constant feedback loop helps you refine broad strategic goals with tactical, data-driven decisions. You avoid the risk of overstocking a product category that your high-level forecast approved but that real-time demand just doesn't support. You can dive deeper into how this works in our article on AI-powered demand forecasting.
One of the biggest headaches for retailers is the disconnect between the finance team's targets and what’s actually happening on the "shop floor." Moving away from outdated models to AI-enhanced ones tackles this problem head-on.
Research shows that traditional top-down forecasts miss the mark on actual demand an astonishing 70% of the time. In contrast, AI-driven approaches that use real-time signals to refine market-level estimates have helped retailers slash overstock by 25% and stockouts by 30%. This is critical, especially when you consider that 60% of mid-sized retailers miss their growth targets due to bad forecasting.
AI platforms like Tociny.ai can push the alignment between your plan and reality to over 95% by flagging anomalies and suggesting smart assortment tweaks. For more on this, check out this insightful report on the future of retail forecasting.
By bringing AI into the mix, you aren’t ditching your top-down strategy—you’re supercharging it. The AI essentially acts as a validation engine, constantly checking your high-level assumptions against what customers are actually buying.
AI doesn't just make your top-down forecast more accurate; it makes it more resilient. It gives you an early warning system to help you pivot your strategy before a small discrepancy snowballs into a massive inventory problem.
This combination creates a powerful feedback loop:
This synergy lets you plan with the confidence of a big-picture strategist while executing with the precision of a data scientist. It’s the key to turning ambitious goals into profitable growth.
Got questions about top-down forecasting? You're not alone. Here are some quick, straightforward answers to the things we hear most often from ecommerce founders.
Think of your main top-down forecast as an annual or semi-annual planning exercise. It’s your north star for the year.
But the real magic is in checking your assumptions more frequently. The numbers you plugged in—like your target market share or the industry’s growth rate—should be revisited every quarter. This keeps your big-picture goals grounded in what's actually happening in your business and the market right now.
Absolutely. In fact, it's a game-changer for new stores with little to no sales history.
When you don't have past performance data to build a forecast from the bottom up, you can start from the top. By looking at the total market size, you can set realistic sales goals and make smarter initial inventory buys. It gives you a solid, data-backed foundation to build on from day one.
Top-down forecasting isn't just a "big corporation" game. For a startup, it’s how you turn a grand vision into a real, quantifiable business plan. That’s exactly what you need to secure funding and make smart bets on your first inventory orders.
Good data is easier to find than you might think. Start with the big players in market research like Statista, Gartner, or Nielsen; they often publish high-level reports on market size.
Government sources like the U.S. Census Bureau are also goldmines for economic data. If you’re in a niche industry, check out publications from your specific trade associations—they often have the most relevant stats.
One isn't "better" than the other—they just have different jobs. Top-down is your go-to for setting high-level strategic goals, especially when you're launching a new brand and have no historical data. Bottom-up, on the other hand, is perfect for detailed, short-term operational planning for products you already sell.
The most powerful approach is to use them together. Here's how: 1. Use a top-down forecast to set your ambitious annual revenue targets. 2. Then, use a bottom-up forecast to check if your current SKU-level sales trends can realistically get you there.
Ready to connect your big-picture goals with the day-to-day reality of your inventory? Tociny.ai uses AI to close the gap between your top-down vision and the granular demand data you need to slash overstock and wipe out stockouts. Plan your inventory with confidence by visiting https://tociny.ai.
Tociny is in private beta — we’re onboarding a few select stores right now.
Book a short call to get early access and exclusive insights.