The average days in inventory calculation is more than just a number—it’s a crucial health check for your business. It tells you exactly how many days it takes, on average, to turn your physical stock into cold, hard cash.
When that number is high, it means your money is trapped on shelves. When it's too low, you're likely staring down the barrel of costly stockouts. Getting a firm grip on this metric is the first real step toward building a smarter, more profitable inventory strategy.
Let's be honest, "Average Days in Inventory" (or DSI) sounds like some dry, dusty term your accountant would throw around. But for a direct-to-consumer (D2C) brand, this number is the very heartbeat of your business. It’s a direct measure of how long your cash is tied up in physical products just sitting there, waiting for someone to click "buy."
Think about it this way: if you run a Shopify apparel store, a high DSI means last season's collection is still hogging valuable warehouse space. Every single day those items sit unsold, they're racking up storage fees, inching closer to becoming obsolete, and locking up capital you could be using to invest in new, trending products. Eventually, you’re forced into deep clearance sales that gut your profit margins just to get some cash flowing again.
But here’s the catch—a dangerously low DSI isn't a badge of honor. It’s a massive red flag for missed opportunities.
Imagine one of your products goes viral on TikTok overnight. If your DSI is too low, you’ll sell out in a flash, leaving thousands of excited customers staring at an empty cart. Not only do you lose out on a mountain of immediate sales, but you also risk damaging your brand's reputation and losing those customers for good.
Your DSI isn’t just another metric; it's a direct reflection of your cash flow efficiency. A healthy DSI ensures capital is constantly flowing back into your business to fund growth, not gathering dust in a warehouse.
For e-commerce merchants, especially those in fast-moving industries like fashion or consumer electronics, a DSI climbing above 60 days often signals trouble. And it's not a small problem. Globally, excess inventory costs retailers an estimated $1.1 trillion every year in write-offs and forced markdowns.
Even a behemoth like Amazon, known for its ruthless efficiency, fights to keep its DSI around 41 days. They do it by using powerful predictive algorithms to perfectly balance supply with demand. You can find more great insights on industry inventory benchmarks from Shopify’s retail experts.
This guide is here to reframe DSI. It’s not a chore for your finance team, but your secret weapon for a healthier, more profitable inventory strategy.
Alright, let's get into the numbers. Forget the dense textbook definitions for a minute. There are really two straightforward ways to calculate your average days in inventory, and understanding both will give you a much clearer picture of your inventory's health.
This is the most direct route and probably the easiest one to start with. It ties the value of the inventory you're holding directly to how quickly you're selling it.
Here’s the formula:
DSI = (Average Inventory / Cost of Goods Sold) * 365
Let's quickly break down what this means for your store:
A Practical Shopify Example
Let's say you run a home decor store on Shopify. You want to figure out your DSI for the last year, so you pull up your reports.
You find your average inventory was valued at $80,000, and your total COGS for the year was $300,000.
Plugging those numbers into the formula:
DSI = ($80,000 / $300,000) * 365 DSI = 0.2667 * 365 DSI = 97.3 days
What does this tell you? On average, one of your throw pillows or scented candles sits on a shelf for a little over 97 days before a customer buys it.
The second way to calculate DSI is by using another key metric: your inventory turnover ratio. This approach is powerful because it highlights the direct relationship between how many times you flip your inventory and how long it sits around.
The formula is even simpler:
DSI = 365 / Inventory Turnover Ratio
To use this, you first need your Inventory Turnover Ratio, which is calculated as COGS / Average Inventory. This number tells you how many times you sold through your entire inventory in a year. If you want to dive deeper, we have a complete guide on mastering your inventory turnover ratio calculator.
Let’s go back to our home decor store example:
Inventory Turnover = $300,000 / $80,000 = 3.75
This means the store sold and replaced its entire inventory 3.75 times over the year. Now, let's find the DSI:
DSI = 365 / 3.75 = 97.3 days
See? Both roads lead to the same destination. The first formula is a direct calculation, while the second really helps you visualize the powerful inverse relationship between turnover and holding time. When one goes up, the other must come down.
For a consumer electronics brand with $100,000 in average inventory and $500,000 in COGS, the DSI works out to 73 days. While tolerable, this is beatable in an industry where top performers aim for 20-30 days. Read more on how different benchmarks affect inventory strategy and what DSI means for your cash flow on ShipBob's blog.
A formula is only as good as the numbers you plug into it. To get an accurate average days in inventory calculation, you’ll need to do a little data detective work inside your own Shopify store. Getting this right is a cornerstone of solid ecommerce operations and smart inventory management.
The two critical pieces of the puzzle are your Cost of Goods Sold (COGS) and your Average Inventory value. Let's break down exactly where to find them and how to calculate them properly.
Thankfully, finding your COGS in Shopify is pretty straightforward. Shopify tracks this for you automatically, as long as you’ve been diligent about entering the "cost per item" when adding products to your store.
To pull your total COGS for a specific period (like the last 365 days):
This report spits out the net sales and, most importantly, the cost of goods for that timeframe. That number is the direct cost of everything you sold—exactly what we need for the DSI formula.
Figuring out your average inventory requires a bit more thought. This isn't just the value of your inventory right now; it's a smoothed-out number that accounts for the natural ebb and flow of stock levels.
There are two main ways to tackle this.
The Simple Periodic Method If you're doing a quick, high-level analysis—maybe for an annual review—this is the fastest way to get a number.
Average Inventory = (Beginning Inventory Value + Ending Inventory Value) / 2
To get these figures, you'd run an inventory report in Shopify for the start and end dates of your period (say, January 1st and December 31st). It's easy, but be warned: this method can be skewed if a huge stock delivery landed right before you ran the report.
The More Accurate Rolling Average For most businesses, especially seasonal ones (think swimwear in summer or ski gear in winter), a rolling average gives a much truer picture of your inventory situation.
For a more granular view, you can take inventory snapshots at the end of each month, add them all up, and divide by the number of months. For example, to calculate DSI for the last quarter, you'd add the inventory values from the end of all three months and divide by three.
This approach smooths out the peaks and valleys, giving you a far more reliable number for your calculation. To dig deeper into leveraging your Shopify data, check out our insights on improving Shopify store management.
This visual flow shows how each piece of data slots into the final DSI calculation.
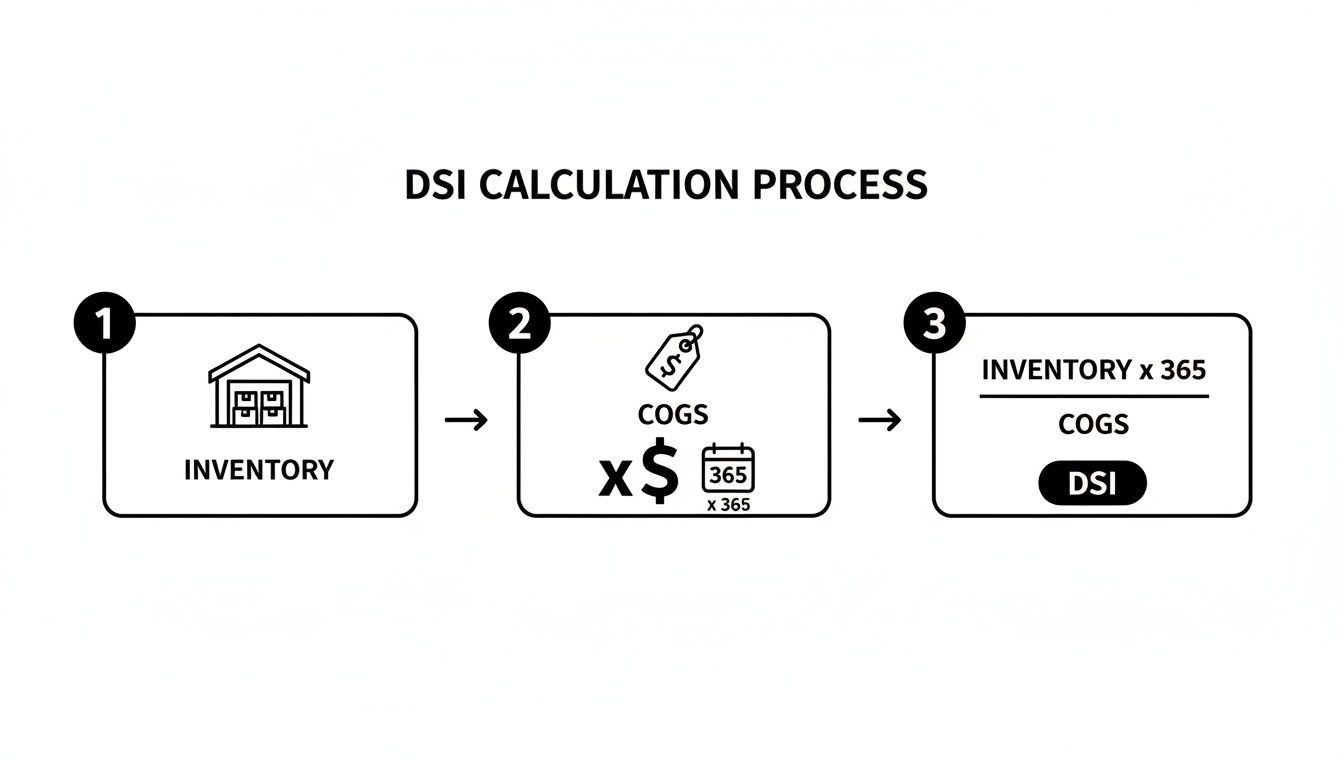
As you can see, a reliable DSI figure depends entirely on having accurate inputs for both your inventory value and your COGS over a specific time frame, typically a full year.
Alright, you've crunched the numbers and have your DSI. Now what? This is the moment a simple metric becomes a powerful strategic tool, but only if you understand the story it's telling.
Let's get one thing straight: a "good" DSI isn't a universal number. A DSI of 90 days could be fantastic for a merchant selling high-end, made-to-order furniture. Long lead times and slow sales cycles are just part of the game there. But for a fast-fashion beauty brand? A 90-day DSI is a five-alarm fire, signaling a warehouse full of yesterday's trends and a serious cash flow crisis. The very first step is to benchmark your number against your specific industry.
Your DSI isn't a static snapshot. Its movement over time is where the real insights are hiding. You need to pay close attention to which way it's heading.
Globally, the average inventory turnover rate recently hit 8.5, which works out to a DSI of about 43 days (365 / 8.5). But this average smooths over massive differences between sectors. Financial industries cycle incredibly fast, while home goods often move at a snail's pace. The retail giant M&S, for example, managed to hold its DSI steady around 36-37 days even through major disruptions by strategically using seasonal buffering. You can get a better feel for these industry benchmarks by exploring Finale Inventory's insights.
The goal isn't just to calculate DSI—it's to interpret its trajectory. A single calculation is a snapshot; tracking it quarterly or monthly reveals the plot of your inventory story.
This might be the most important takeaway: your store-wide DSI can be dangerously deceptive. A healthy-looking average can easily mask huge problems at the individual product level. This is where you have to zoom in from the portfolio view to a granular, SKU-level analysis.
Imagine your Shopify store has a total DSI of 45 days. Sounds pretty good, right? But let's look under the hood.
Without that SKU-level detail, you’d be patting yourself on the back for a "healthy" average, completely blind to the fact that you have an urgent stockout risk and a cash-draining liability on your hands. This is why the average days in inventory calculation is just the starting line. It's the key that unlocks smarter, more profitable questions about every single item you sell.
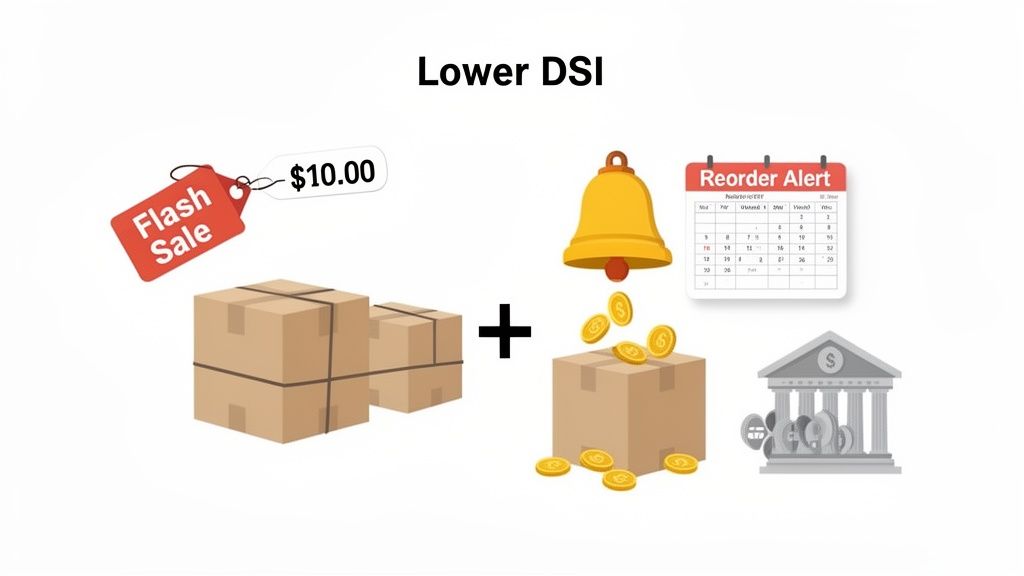
A lower DSI means cash in your bank, not on your shelves. Once you have a reliable average days in inventory calculation, you can finally stop analyzing and start acting.
This isn't just theory; it's a playbook of proven tactics to get your inventory moving and free up that precious capital. The goal is to convert aging stock back into cash as efficiently as possible. This requires a targeted approach—moving beyond store-wide discounts and focusing on the specific products dragging your DSI down.
Honestly, one of the fastest ways to lower DSI is to prevent over-ordering in the first place. This means dialing in your reorder points so you aren't bringing in new stock until you truly need it.
A simple yet incredibly effective reorder point formula is:
(Average Daily Sales × Lead Time in Days) + Safety Stock = Reorder Point
By calculating this for each individual SKU, you can shift from gut-feel purchasing to a data-driven system. This simple change prevents you from tying up cash in products that are still selling through, which directly contributes to a lower overall DSI. Don’t just set these numbers once and forget them; revisit them quarterly as sales trends and supplier lead times inevitably change.
Not all slow-moving stock needs a steep, profit-killing discount. Sometimes, it just needs a little nudge. Smart, strategic promotions can move that aging inventory without devaluing your entire brand.
For a Shopify store, this can be as simple as setting up an automated email flow in Klaviyo. Create a segment of customers who have viewed a slow-moving product but haven't purchased, and send them a targeted offer with a unique discount code to nudge them over the finish line.
Solid demand forecasting is the bedrock of a healthy DSI. While there are complex algorithms out there, you can start with some straightforward methods that work.
A great starting point is to look at your sales data for the same period last year and then adjust for your current growth rate.
Analyze your sales velocity at the SKU level to spot trends. Is a product's popularity starting to fade? It might be time to lower its reorder point or discontinue it altogether before it becomes dead stock. For a deeper dive into optimizing your stock levels, exploring these 10 inventory management best practices can provide some really valuable insights.
Calculating your DSI in a spreadsheet is a fantastic first step. Seriously, you're already ahead of the curve. But let's be honest—it's just a snapshot in time. A spreadsheet can tell you what your inventory looked like last quarter, but it’s completely blind to what's happening right now or what’s coming next month.
To really get a grip on your inventory, you need to see the whole movie, not just a single frame.
This is exactly why so many D2C brands are ditching the spreadsheets for something smarter. Manual tracking isn't just a time sink; it's a minefield of human error. One misplaced decimal in a formula can domino into ordering too much of a slow-mover or stocking out of a bestseller. Worse, you're always steering the ship by looking at the wake behind you—making future decisions with old data.
This is where dedicated inventory platforms completely change the game. By plugging directly into your Shopify store, they automate the grunt work of collecting data and crunching the numbers. But it’s not just about getting your DSI faster. It’s about unlocking a layer of insight that a spreadsheet could only dream of.
The real power here isn’t just calculating metrics; it's turning those numbers into proactive, money-making decisions. You stop reacting to last month's reports and start anticipating next month's demand.
Instead of spending half a day wrestling with CSV exports, you get a live dashboard showing the health of every single product. A modern platform gives you superpowers like:
It’s a fundamental move from reactive analysis to proactive control. If you're ready to make that leap, exploring modern inventory management software is the logical next step. It's the bridge to making smarter, faster, and much more profitable inventory decisions.
Even after you've nailed down the formulas, a few practical questions always seem to pop up when you start applying the average days in inventory calculation to your own business. Getting these details right is what turns a simple metric into a powerful strategy.
This is one of the first things merchants ask, and the answer really depends on your business. For a solid, big-picture health check, calculating DSI quarterly is a great starting point. This rhythm helps you spot long-term trends without getting lost in the weeds of weekly or daily sales spikes.
But if you're in a fast-moving space like fashion or deal with seasonal products, you’ll want to tighten that up to a monthly calculation. A monthly check-in gives you a much sharper picture, allowing you to react quickly to what’s happening on the ground and adjust your ordering before a small issue snowballs.
It’s tempting to chase the lowest DSI possible, but be careful—this can backfire, and quickly. An extremely low DSI is often a flashing warning light for frequent stockouts. While seeing products fly off the shelves feels great, every time a customer hits that dreaded "Sold Out" button, you’ve lost a sale. Worse, you might have lost their trust for good.
The goal isn't just to get the lowest number. It's about finding that sweet spot—a DSI that keeps your cash flowing without constantly leaving money on the table because your bestsellers are out of stock.
Think of these two metrics as different sides of the same coin. They both measure how efficiently you’re moving inventory, but they tell the story from a slightly different perspective.
At their core, they measure the same thing: inventory velocity. But for day-to-day planning, most merchants find DSI way more practical. It’s just easier to think and plan in "days" than in "turns per year."
Ready to move beyond manual spreadsheets and get AI-powered recommendations to optimize your DSI? Tociny.ai connects to your Shopify store to provide clear sales forecasts and actionable inventory insights, helping you prevent stockouts and reduce overstock. Join the private beta to get early access.
Tociny is in private beta — we’re onboarding a few select stores right now.
Book a short call to get early access and exclusive insights.