Sales forecasting techniques are simply the different ways businesses predict future revenue. These methods can be anything from straightforward historical averages to incredibly sophisticated AI-powered predictive models. At the end of the day, they all aim to help you make smarter decisions about your inventory, budget, and overall strategy.
The right technique can transform pure guesswork into a reliable roadmap for growth.
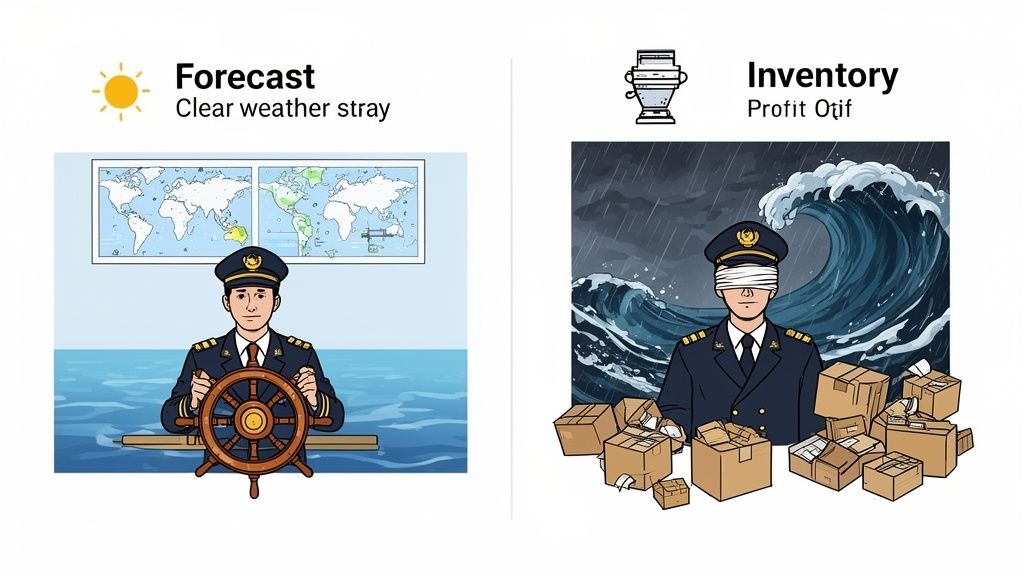
It’s time to stop thinking of sales forecasting as a chore. For a direct-to-consumer (D2C) brand, it’s your competitive edge. Trying to navigate the market without a solid forecast is like being a ship's captain sailing blindfolded—you might get lucky, but you're far more likely to sail right into the costly storms of stockouts and overstock.
Ever lost thousands in potential sales because your best-seller ran out during a holiday rush? Or felt the pain of having warehouses full of unsold inventory, tying up cash that should be fueling your marketing? These aren't just hypotheticals; they're the daily reality for brands flying blind.
Mastering sales forecasting techniques is how you shift from being reactive to proactive. Instead of just guessing how much inventory to order, you start making data-driven decisions that have a real, measurable impact on your bottom line. It's no surprise that companies with accurate forecasting are far more likely to hit their revenue goals.
An effective forecast is the bedrock of a healthy D2C operation. It influences every major decision you make.
"Proper forecasting—that is, a sales forecast that results in accurate projections backed by reliable data—requires an understanding of purpose, context, and intended outcome."
This kind of strategic foresight gives you the confidence to allocate resources effectively, turning raw numbers into a clear path toward profitability. For a deeper look, our guide on improving demand forecast accuracy digs into this even more.
When you can confidently predict what your customers will want, the benefits ripple across your entire business. This is about more than just having the right products on the shelf; it's about building a more resilient and efficient company from the ground up.
Here are the key advantages you'll see:
Ultimately, adopting the right sales forecast techniques is your roadmap from just surviving to truly thriving. In this guide, we'll break down the core approaches—from simple historical analysis to advanced AI-driven models—into actionable strategies you can start using today.
The easiest place to start with sales forecasting is by simply looking in the rearview mirror. By digging into your store's past performance, you can set a solid baseline for what’s likely to happen next.
Think of it like a sports team studying old game tapes. Your historical sales data is a recording of your customers' past behavior, and it’s packed with clues about what they’ll do in the future.
For any Shopify store, your order history is a goldmine. It's the most basic dataset you have, and it costs nothing to access. This approach runs on a simple idea: what happened before is likely to happen again, especially for your bread-and-butter products with stable demand.
Historical forecasting isn't just one single technique; it's a whole family of straightforward but effective methods. The core idea is to smooth out the random noise in your sales data—those random spikes and dips—to see the real trend underneath. This stops you from overreacting to a single amazing week or a disappointingly slow one.
Two of the most common methods for D2C brands are:
These methods are the bedrock of countless inventory decisions. In fact, historical sales forecasting has been a staple for e-commerce since the early 2010s.
A McKinsey study found that in 2020, retailers using historical averaging methods reduced inventory stockouts by 25% during the holidays. They looked at previous years' data—which showed December fashion sales peaking at 150% of the monthly average—to correctly stock up on trending items like athleisure wear. You can find more practical forecasting insights on gong.io.
Let's say you sell a popular brand of coffee beans on your Shopify store. To figure out how much to order for the next quarter, you can calculate a 90-day simple moving average.
Boom. Your moving average is 20 bags per day. You can now use this as a baseline to forecast that you'll sell roughly 600 bags next month (20 bags/day x 30 days). This simple math takes you from pure guesswork to a data-backed estimate for your next purchase order.
Key Takeaway: Using a moving average helps you look past the daily chaos to see a more stable, reliable demand signal for your products.
As useful as this technique is, it has its limits. Knowing its strengths and weaknesses is the key to using it effectively without getting tripped up. It's a fantastic starting point, but it’s definitely not a one-size-fits-all solution.
The Advantages:
The Disadvantages:
Ultimately, historical analysis is your foundational tool. It grounds your decisions in actual data, helping you sidestep costly errors and setting the stage for more advanced sales forecast techniques.
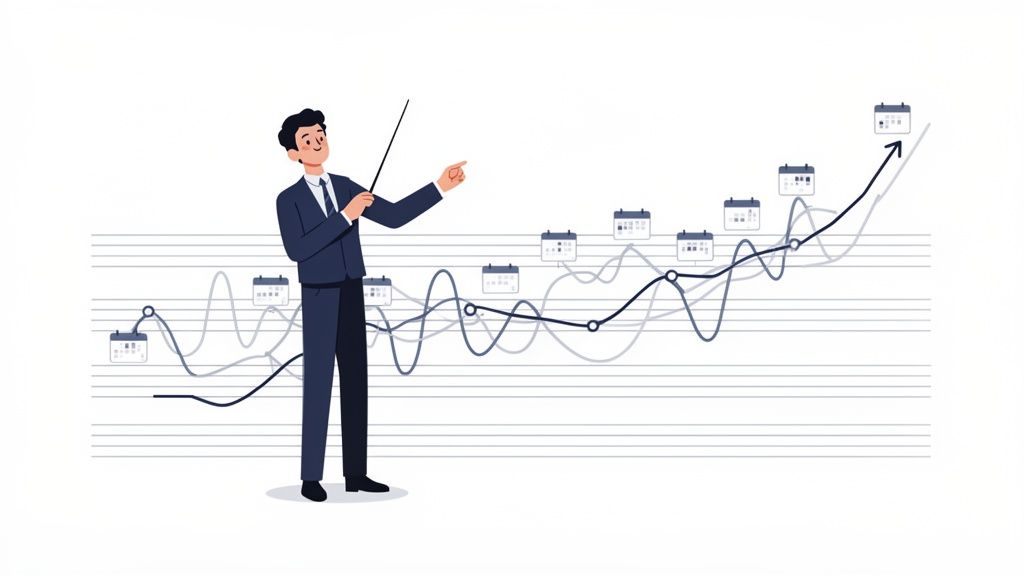
While looking at historical averages gives you a decent baseline, it doesn't really capture the natural rhythm of your sales. It’s time to get a bit more sophisticated. Time series analysis is a powerful technique that goes beyond simple averages to find predictable patterns hidden in your sales data over time.
Think of it like a musician listening to a song. A basic analysis might tell you the average volume, but a time series approach helps you hear the repeating chorus (seasonality), the rising tempo (trend), and the occasional unexpected guitar solo (irregularities). When you understand this rhythm, you can predict what’s coming next with much greater accuracy.
This method helps you see predictable shifts in demand coming, ensuring you’re perfectly stocked for the annual summer rush or the Black Friday frenzy without tying up cash in inventory during slower months.
Time series analysis works by breaking down your sales history into a few key components. Getting a handle on these building blocks is the first step toward creating a much smarter forecast for your Shopify store.
Here are the main patterns this technique hunts for:
By separating these components, you can build a model that understands not just what happened, but why it happened at a specific time.
One of the real workhorses of time series analysis is the ARIMA (AutoRegressive Integrated Moving Average) model. The name sounds complicated, but its job is simple: it learns from its own past forecasting mistakes to get smarter over time.
Imagine you're trying to hit a moving target. If your first shot lands a bit to the left, you naturally adjust your aim to the right for the next one. ARIMA does something similar with your sales data, constantly correcting its predictions based on how accurate its previous forecasts were.
Time series forecasting techniques are essential for inventory planning in competitive e-commerce. They use historical patterns like trends and seasonality to achieve high accuracy.
These models are incredibly effective for businesses with stable, yet cyclical, demand. In fact, time series methods have delivered up to 92% accuracy for retailers. In one real-world case, a consumer electronics store on Shopify used an ARIMA model to predict Black Friday sales would be 220% of their baseline. The result? Zero stockouts and a 35% revenue lift compared to competitors who were caught off guard. You can dive deeper into how statistical models predict sales on ForecastPRO.com.
While the math behind models like ARIMA can get intense, you don't need a Ph.D. in statistics to use them. Platforms like Tociny.ai are designed to do all the heavy lifting for you. Our system automatically digs into your sales history to identify these crucial patterns.
The sales forecast chart in Tociny.ai visualizes these trends and seasonal peaks, letting you see exactly when to expect surges in demand for specific SKUs. This turns a complex statistical process into a clear, actionable guide for your inventory planning.
By using these advanced sales forecasting techniques, you can stop just reacting to sales and start truly anticipating them. You'll be able to confidently prepare for the next big holiday, knowing your forecast is built not on simple averages, but on the true, underlying rhythm of your business.
So far, we’ve been looking inward, using your store’s own sales history to predict the future. But what about everything happening outside your business that pulls your customers’ strings? This is where causal forecasting steps in, shifting the focus from what happened to why it happened.
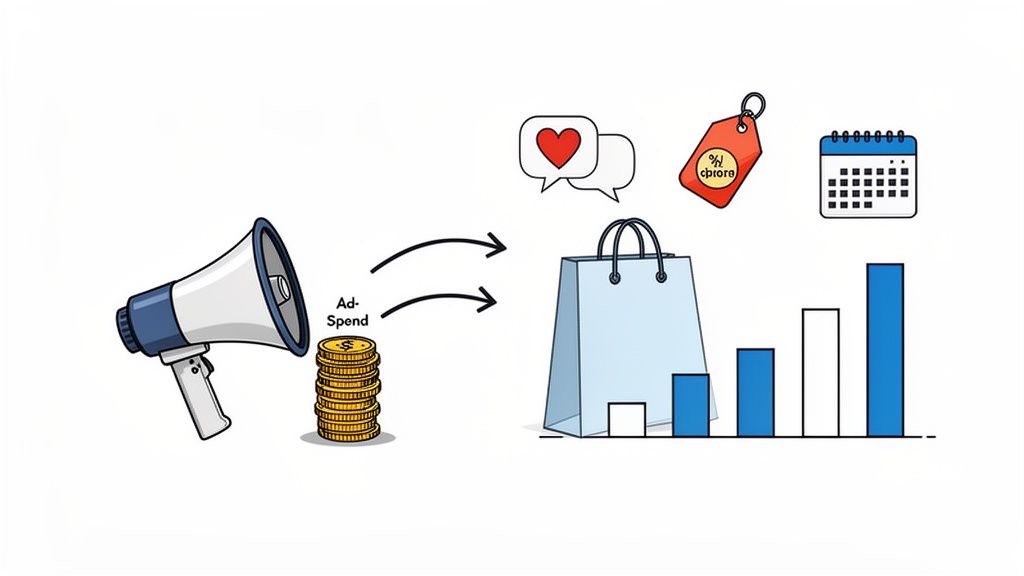
Think of it as simple cause and effect. You launch a huge influencer campaign (the cause), and you see a predictable jump in sales (the effect). Causal models are all about figuring out the math behind these relationships, turning your business decisions into predictable results.
Instead of just staring at past sales charts, you start investigating the specific triggers that make those numbers go up or down. It's a powerful approach because it helps you see exactly how a change in strategy—or a shift in the market—will hit your bottom line.
At its heart, causal forecasting is about finding the "independent variables" that influence your sales. For a Shopify store, these drivers are anything that convinces a customer to click "buy" or close the tab.
To do this right, you need to be a bit of a detective, digging into data from both inside and outside your company. You're hunting for clear, undeniable connections.
For D2C brands, some of the most common causal factors include:
By putting these relationships under the microscope, you can build a much more dynamic and realistic forecast that actually responds to the world around it.
The go-to tool for causal forecasting is regression analysis. This is a statistical technique that uncovers the mathematical link between your sales and the drivers you've identified. It basically spits out a formula that shows how much each factor moves the needle on your revenue.
Let’s say you run a Shopify store selling skincare. After running a regression analysis, you find a crystal-clear pattern: for every $1,000 you pump into Instagram ads, sales of your best-selling serum jump by 20% the following week.
Key Insight: This is a total game-changer. Marketing is no longer just a hopeful expense; it's a predictable growth lever. You can now forecast that spending $5,000 on ads next month should logically produce a 100% sales increase for that serum, giving you the confidence to order the right amount of inventory.
This is what makes causal forecasting so valuable. It turns fuzzy correlations into a strategic formula you can use to plan your stock, budget, and marketing with a whole new level of confidence.
But what if you have zero sales history? This is where causal methods can team up with qualitative techniques to forecast a brand-new product launch. When you can't look back at data, you have to survey the landscape ahead.
This means gathering subjective information to get a feel for potential demand:
Sure, it’s not as precise as a data-driven model, but it provides a critical starting point. It keeps you from launching completely in the dark and gives you a reasoned estimate to guide that crucial first inventory order. By tying your internal plans to external signals, causal forecasting gives you a complete picture of what's to come.
Welcome to the future of inventory management. While other sales forecasting techniques juggle a handful of variables, artificial intelligence and machine learning models are like having a team of thousands of data scientists working for you around the clock. They can process a staggering number of variables at once, spotting hidden patterns that are simply invisible to the human eye.
This is where you graduate from just looking at your own sales history. AI can digest everything at the same time: your historical sales data, current marketing campaigns, competitor pricing, website traffic, and even external signals like Google search trends or social media buzz.
Think of it like this: a traditional forecast might see that your athletic wear sales are up. An AI-powered forecast can tell you why. It can connect that sales lift to a new fitness challenge trending on social media, rising search interest for "home workouts," and a competitor's recent price hike, all in a single, unified analysis.
This knack for finding complex, non-obvious connections is what makes AI so powerful. It shifts your business from reacting to what’s already happened to proactively anticipating what will happen next.
Here’s a taste of what AI models can analyze that simpler methods just can't:
At the heart of this technique is predictive analytics. AI models don't just look at data; they learn from it. Every new sale, marketing push, and market shift feeds the model fresh information it uses to refine its predictions, making them sharper over time.
This continuous learning cycle leads to hyper-accurate inventory decisions that slash waste and help you capture every single sales opportunity. In fact, one study found that more than half of CFOs say outdated information still torpedoes their ability to make accurate forecasts. AI solves this by always working with the most current data available.
The real magic of AI models is their ability to learn continuously. They get smarter and more precise as they process more data, leading to forecasts you can truly rely on.
For Shopify stores, this means getting recommendations that are always in sync with the latest market realities. You can learn more about how AI is transforming demand planning and helping businesses get ahead of the curve.
Imagine you sell supplements on Shopify. An AI platform like Tociny.ai could detect a subtle but growing search trend for a specific new wellness ingredient. At the same time, it might notice that a key competitor is running low on stock for a similar product.
The system could then flag a probable demand surge weeks before it becomes obvious, recommending a specific purchase order quantity. This gives you a critical head start to capture market share while others are still scratching their heads, trying to figure out what's going on. To make the most of this, understanding how to use AI for marketing is key for feeding your forecasting models with high-quality campaign data.
While all this might sound complicated, the goal of modern AI tools is to make this power accessible. You don't need a team of data scientists to get started.
AI-driven sales forecasting is a perfect fit for:
By bringing AI into your operations, you’re not just forecasting sales. You're building an intelligent system that helps you understand your market and customers on a much, much deeper level.
Choosing the right forecasting method can feel overwhelming. Each approach has its own strengths, weaknesses, and data needs. To make it easier, we've put together a quick comparison to help you see which technique might be the best fit for your Shopify store.
| Forecasting Technique | Best For | Data Required | Pros | Cons |
|---|---|---|---|---|
| Time-Series Analysis | Businesses with stable sales history and predictable seasonality. | At least 2-3 years of historical sales data. | Simple to implement, good for stable products, requires minimal data. | Ignores external factors (marketing, competition), inaccurate during market shifts. |
| Causal Forecasting | Brands that want to understand how specific actions (ads, promotions) impact sales. | Historical sales, marketing data, competitor data, economic indicators. | Highly accurate, explains why sales change, great for strategic planning. | Complex, requires extensive and clean data, can be costly to set up. |
| AI/Machine Learning | Growing stores with multiple SKUs, complex patterns, and rich data sets. | Large volumes of diverse data (sales, marketing, customer, external signals). | Extremely accurate, self-improving, identifies hidden patterns, adapts to change. | Can feel like a "black box," requires significant data, tool-dependent. |
| Hybrid Approach | Most D2C brands looking for a balanced and resilient forecasting strategy. | A mix of historical sales and relevant causal data (e.g., ad spend). | Balances simplicity and accuracy, more resilient than a single method, adaptable. | Can be more complex to manage than a single approach. |
This table gives you a starting point. The best technique often depends on your specific business goals, the data you have available, and how much complexity you're willing to manage. For many brands, starting with a simple method and evolving toward a more sophisticated or hybrid approach is a practical path forward.
Alright, theory is one thing, but putting it into practice is what actually moves the needle. Let's build a straightforward playbook to get your sales forecasting process off the ground. The goal here isn't perfection on day one; it's about creating a system that gets smarter every month.
First things first: your forecast is only as solid as the data you feed it. Before you do anything else, you need to clean up and organize your sales history from Shopify. This means hunting down and correcting anomalies, making sure your product names are consistent, and filtering out those wild one-off flash sales that would otherwise throw off your numbers. A clean dataset is the foundation for everything that follows.
Next up, pick the right technique for where your business is right now. Seriously, don't overcomplicate this. A simple approach you actually stick with is miles better than a fancy model that collects dust.
Once you’ve picked your method, get a consistent forecasting schedule on the calendar. A monthly review is a fantastic place to start. This creates a rhythm, letting you compare your predictions against what actually happened. It’s how you’ll learn where your model is hitting the mark and where it needs a little tweaking.
The real goal of a forecasting playbook isn't just to guess the future. It's to build a system that learns from the past. Every cycle of forecasting, measuring, and refining makes your business smarter and more resilient.
Finally, you have to track your forecast accuracy. It's as simple as calculating the difference between your prediction and your actual sales. This one metric is your most important guide for getting better. As your store grows, you'll eventually outgrow the trusty spreadsheet, and that's when a dedicated tool becomes a game-changer. To get a feel for how specialized software automates all this, check out our guide on the top demand forecasting software for D2C brands.
The flowchart below gives you a peek into how an AI-powered tool thinks, processing your data to deliver incredibly precise forecasts.
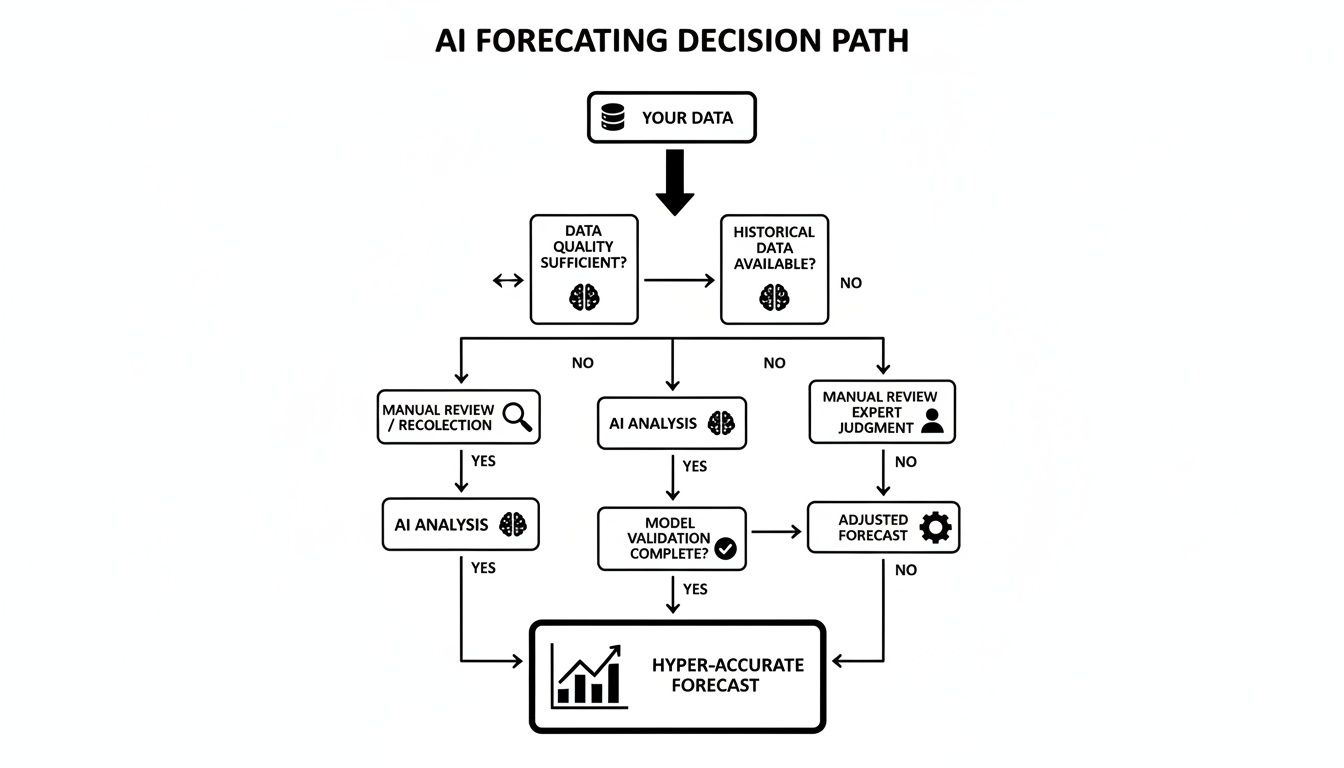
This visual shows exactly how AI can take your raw data, uncover patterns you'd never spot on your own, and produce a forecast that's worlds more accurate than what you could do manually.
Even after getting the lay of the land with different forecasting techniques, it's totally normal to have a few questions rattling around. Nailing down the details is what turns theory into a real, working strategy for your Shopify store. Let's dig into some of the most common questions we hear from e-commerce managers.
The right cadence really comes down to your sales cycle and how stable your market is. For D2C brands in fast-moving spaces like fashion or consumer electronics, a monthly review is a great place to start. It’s frequent enough to let you react to new trends or marketing campaigns without getting lost in the day-to-day noise.
If your business has a longer, more predictable sales cycle, you might find a quarterly forecast update works just fine. The real key here is consistency. Pick a schedule and stick with it. That’s how you’ll be able to track your accuracy over time and make adjustments that actually mean something.
There's no magic bullet here. The "best" method is simply the one that fits your business's data, maturity, and specific goals. It's all about context.
Honestly, a hybrid approach often delivers the most reliable results. When you combine the stability of historical data with the real-world impact of your marketing efforts, you get a forecast that's much more resilient and realistic. It adapts to what's happening both inside and outside your business.
Forecasting for a product with zero sales history is more art than science, but it doesn't have to be a complete shot in the dark. Since you can't look backward, you have to look outward for clues.
First, do some market research on similar products. This helps you establish a realistic benchmark for potential demand. Then, use customer surveys to get a direct read on interest from your own audience. Combining these insights gives you an educated guess to start with. It won’t be perfect, but it’s a data-informed starting point that keeps you from launching completely blind.
Ready to move beyond spreadsheets and guesswork? Tociny.ai uses AI to analyze your Shopify data, identify hidden trends, and deliver hyper-accurate inventory recommendations. Stop reacting to the market and start anticipating it. Get early access to Tociny.ai today.
Tociny is in private beta — we’re onboarding a few select stores right now.
Book a short call to get early access and exclusive insights.