
Days Inventory on Hand (DOH) is one of those metrics that sounds more complicated than it is. At its core, it tells you the average number of days your business takes to sell through its entire inventory.
Think of it this way: a high DOH means your cash is tied up in stock that isn't moving, while a super low number could signal that you're about to run out of product and miss out on sales. Getting a handle on how to calculate days inventory on hand is your first real step toward smarter purchasing and healthier cash flow.
It helps to stop thinking about your inventory as just products on a shelf and start seeing it as stacks of cash waiting to be unlocked. Days Inventory on Hand tells you exactly how long that cash stays locked up. For any Shopify store, it's a critical health check that gives you a clear line of sight into your cash flow efficiency and overall profitability.
A high DOH isn't just a number on a spreadsheet; it's a bright red warning sign. It often points to hidden holding costs—like warehousing fees, insurance, and the risk of products becoming obsolete—that are quietly eating away at your margins. On the flip side, an extremely low DOH might look great at first glance, but it can be a red flag for imminent stockouts, which lead to lost sales and frustrated customers.
Once you start tracking this metric, you can shift from being reactive to proactive with your inventory. Instead of guessing when to reorder or which products need a discount, you can make decisions backed by actual data. This simple calculation empowers you to:
This metric transforms inventory from a logistical headache into a strategic asset. By regularly calculating DOH, you gain a powerful tool for maintaining a healthy balance between supply and demand, which is essential for sustainable growth.
With global online sales continuing to climb, mastering metrics like DOH is no longer optional. The standard formula—(Average Inventory / Cost of Goods Sold) × 365—gives you a precise measure of how quickly your inventory is moving.
Of course, what's "good" varies wildly by industry. Electronics retailers often aim for a tight 25-35 days, while fashion brands might be comfortable with a wider 40-50 day window. Knowing where you stand in that context is the key to staying competitive. You can discover more insights on how DOH impacts e-commerce success and start making smarter moves.
Use this quick reference table to see how your DOH stacks up against typical ranges in different ecommerce sectors. This context helps you set realistic inventory goals.
| E-commerce Sector | Optimal DOH Range |
|---|---|
| Fashion & Apparel | 40 - 70 days |
| Electronics | 25 - 45 days |
| Home Goods & Furniture | 60 - 90 days |
| Health & Beauty | 35 - 60 days |
| Food & Beverage (Non-perishable) | 20 - 40 days |
| Sporting Goods | 50 - 80 days |
Remember, these are just guidelines. Your specific business model, supplier lead times, and sales velocity will determine your ideal DOH. The goal is to find the sweet spot that maximizes sales without tying up too much cash in stock.
You don't need a degree in accounting to calculate Days Inventory on Hand. The formula itself is surprisingly straightforward once you know what you’re looking for. At its core, it's a simple health check on your inventory efficiency.
The standard formula looks like this:
(Average Inventory / Cost of Goods Sold) x Number of Days in Period
Let's unpack each of those pieces. Honestly, the hardest part isn't the math—it's just knowing where to pull the right numbers from your business records.
Before you start plugging in numbers, it’s critical to understand what each part of the equation actually means. Getting one of these wrong can throw off the entire calculation and lead you to make some questionable inventory decisions.
Average Inventory: This isn't just a snapshot of what you have on hand today. It’s the median value of your inventory over a set period, which smooths out the constant ebb and flow of sales and new stock deliveries. You find it by adding your Beginning Inventory Value to your Ending Inventory Value and then dividing that by two.
Cost of Goods Sold (COGS): Think of this as the direct cost of the products you sold. It covers what you paid for the materials and labor to create them. It does not include indirect costs like marketing or shipping. You'll almost always find your COGS on your profit and loss statement.
Number of Days in Period: This simply aligns the formula with the timeframe you're analyzing. If you’re looking at a full year, use 365 days. For a quarterly report, you’d use 90 days, and so on.
Why use Average Inventory instead of just the ending balance? It prevents misleading results. Imagine a huge shipment arrives on the last day of the month. Using your ending inventory would make it seem like you have way more stock than you typically do, giving you an inflated and inaccurate DOH figure.
Let's walk through this with a fictional Shopify store, "Cozy Candles Co.," looking at their performance over a full year.
First, we need their Average Inventory. On January 1st, their inventory was valued at $20,000. By December 31st, it had grown to $30,000.
Next, we look at their accounting records and find that their Cost of Goods Sold for the year was $150,000.
Now we have all the pieces we need to calculate days inventory on hand:
So, what does this tell us? On average, it takes Cozy Candles Co. about 61 days to sell through its entire stock. This single number is a powerful benchmark and a fantastic starting point for digging deeper into their inventory health.
Nailing this calculation is also a key step to understanding other crucial metrics. In fact, you'll see these same components pop up in our guide to calculating inventory turnover rate.
Alright, you’ve got the formula down. Now for the real work: digging up the numbers you need from your Shopify account. They won't just jump out at you, but thankfully, Shopify’s built-in reporting is more powerful than most people realize if you know where to click.
To calculate your DOH, you're hunting for two key pieces of data: your Average Inventory (which means you need a beginning and an ending inventory value) and your Cost of Goods Sold (COGS) for that same stretch of time.
Let's get into your Shopify admin and pull that data.
First things first, head over to the 'Reports' section in your Shopify admin. You'll want to navigate to Reports & analytics > Inventory. This area is your go-to for tracking stock levels and their value over time.
The specific report you're looking for is the Inventory value report.
To get the numbers for your Average Inventory calculation, you need to run this report twice. You'll set the date for the start of your period (like January 1st) and then run it again for the end of your period (say, March 31st for Q1). Capturing these two specific snapshots is crucial for an accurate average.
This whole process is about seeing how your inventory investment, sales velocity (COGS), and time are interconnected.
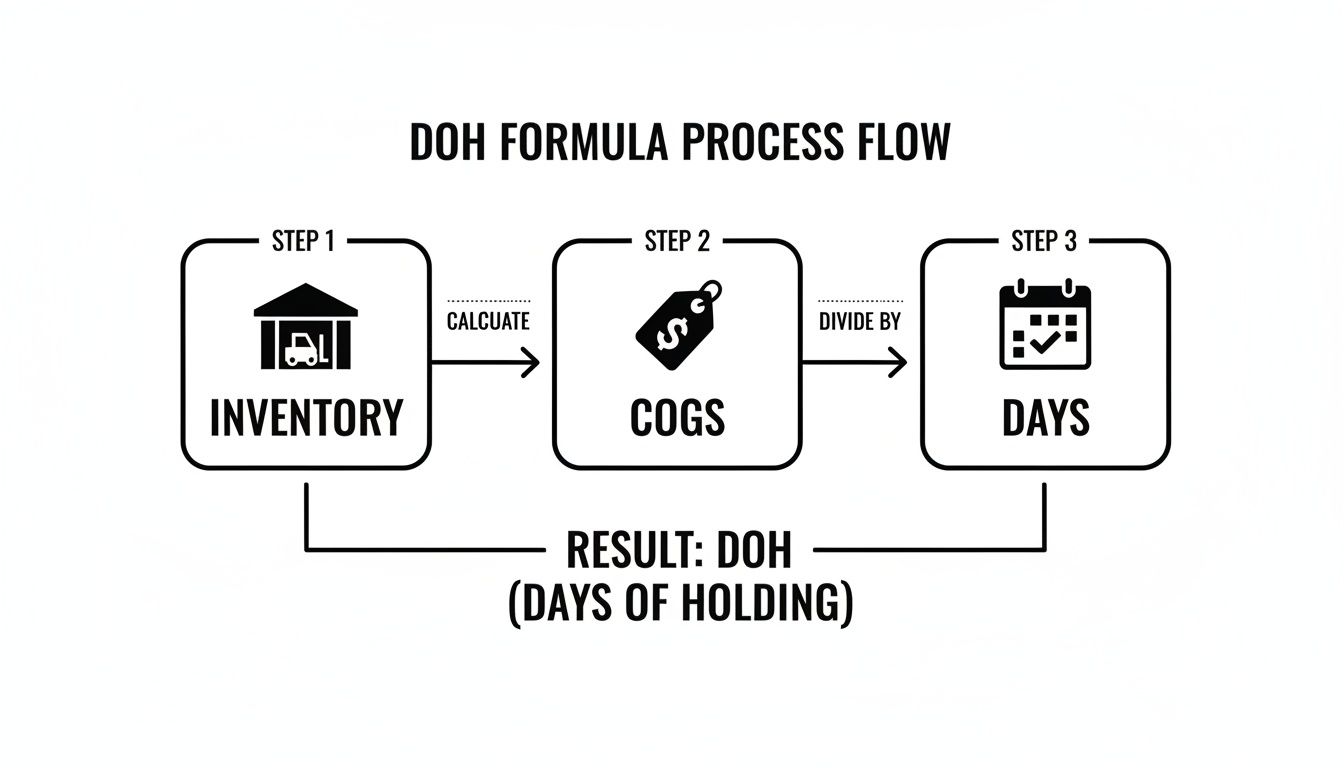
As the diagram shows, DOH is fundamentally a measure of time—how long your cash is tied up in physical products before it turns back into revenue.
Next up is COGS. For this number, you'll stay within the reports section but pivot to Reports & analytics > Finances. The Profit report is where you'll find what you're looking for.
This report gives you a clean breakdown of revenue, costs, and profit, with COGS clearly listed as a primary expense.
Pro Tip: Make absolutely sure the date ranges for your inventory snapshots and your COGS report align perfectly. If you pull inventory values for Q1 but run your COGS report for a slightly different 90-day window, your DOH calculation will be off. Even a one-day mismatch can throw off your results and lead you to make the wrong call on your next purchase order.
Consistency is key here. If you're calculating DOH quarterly, use the first and last day of the quarter for your inventory values and match the COGS report to that exact time frame.
Of course, manually pulling reports isn't the only way. Many dedicated tools offer robust e-commerce inventory management features that can automate this kind of data gathering. And if you’re using third-party apps or accounting software like QuickBooks, your process will be similar—you’ll just pull the reports from those systems instead. For more tips on this, check out our guide on managing your Shopify store.
No matter your tools, the goal is to build a repeatable process you can trust.
Theory is one thing, but putting the DOH formula to work with real numbers is where the lightbulb really goes on. Let's walk through two common situations every Shopify merchant deals with. We'll start with a bird's-eye view to check the health of the entire store, then we'll zoom in on a single product.
This two-pronged approach is essential. The big-picture view tells you a story about your overall cash flow and operational health. But the SKU-level view is where you find the specific products that are either making you money or holding you back.
Imagine you run an online store selling eco-friendly home goods. You want to figure out your store’s DOH for the first quarter (Q1) to see how well you've been managing your overall stock levels.
First, you need to pull a few numbers:
With this data, the first step is to find your Average Inventory for the period:
Average Inventory = ($40,000 + $50,000) / 2 = $45,000
Now, you can plug that into the DOH formula to get your store-wide figure:
DOH = ($45,000 / $120,000) x 90 days = 33.75 days
This means it takes your store, on average, about 34 days to sell through its entire inventory. This number is your new baseline—a solid metric you can now track against future quarters and see how you stack up against industry averages.
Your store-wide DOH is a great starting point, but the real magic happens when you get granular. Let's look at one of your best-sellers, a "Bamboo Cutting Board" set, to see if its turnover rate is as good as its popularity suggests.
Here's the data for that single SKU over the same quarter:
First, let's calculate the Average Inventory specifically for the cutting boards:
Average Inventory = ($3,000 + $2,250) / 2 = $2,625
And now for the DOH on this specific product:
DOH = ($2,625 / $5,250) x 90 days = 45 days
This is a powerful insight. While your store average is a healthy 34 days, this supposed "best-seller" actually takes 45 days to turn over. This could be a sign that you're over-ordering, tying up too much cash in this one product, even though it sells consistently. This is exactly the kind of granular detail that helps you make smarter, more profitable purchasing decisions.
Even the giants of retail live and die by this metric. Take Costco, for example. In May 2024, they maintained a remarkably lean days inventory of around 30.99 days. This was a slight increase from the previous year, which immediately signaled a potential slowdown in sales growth, proving just how sensitive DOH is to market shifts. If you're curious, you can read more about Costco's inventory management data and see how the pros use this exact metric.
Once you have your Days on Hand number, you've got a powerful diagnostic tool at your fingertips. But a number by itself is just noise; the real value comes from understanding the story it tells about your business.
Let's be clear: a "good" DOH isn't a universal figure. It's completely dependent on your industry, product lifecycle, and—most importantly—your supplier lead times.
A high DOH is often a glaring red flag for trapped cash. Every unsold product sitting on your shelf is capital you can't invest in new marketing, product development, or just paying the bills. This can quickly lead to serious cash flow problems, especially for growing brands. Worse, it cranks up the risk of stock becoming obsolete, forcing you into margin-crushing discounts just to clear it out.
Imagine your DOH for a best-selling hoodie is 90 days. Sure, it sells well, but holding three months of stock means you've tied up a huge chunk of money in a single SKU. That's cash that could have been used to launch a new collection or double down on a winning ad campaign. It’s a classic case of opportunity cost, where your inventory is literally holding your business back.
Beyond just the calculation, you have to place your DOH within the broader context of other essential metrics for ecommerce to see the full picture.
On the flip side, a very low DOH isn't always the victory it seems. It might look like you're running a lean, efficient operation, but it could also mean you're constantly teetering on the edge of a stockout.
Let's say your DOH for a popular skincare serum is only 10 days, but you know your supplier's lead time is a solid 14 days. You have a massive problem brewing. You are guaranteed to run out of stock, lose sales, and frustrate loyal customers who will likely just buy from a competitor.
The goal isn't just a low number; it's the right number. Your ideal DOH is a strategic sweet spot—high enough to meet demand without missing sales, yet low enough to keep cash flowing and minimize holding costs.
This is where an AI-powered tool like Tociny.ai can change the game. It automates the DOH calculation for every single SKU in your catalog, which is a massive time-saver. More importantly, it surfaces anomalies for you. The system can flag that 90-day hoodie as a potential overstock risk or warn you about the 10-day serum before it sells out, turning raw data into proactive, profit-saving actions. This frees you from the drudgery of manual analysis and lets you focus on making smart, strategic decisions.
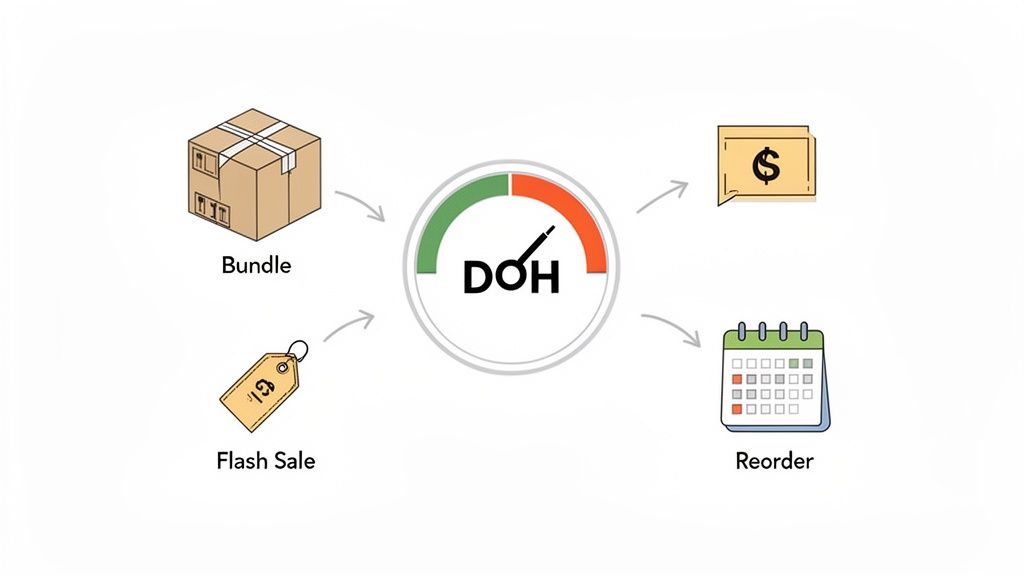
Knowing your Days on Hand is one thing; using that number to actually improve your bottom line is where the real work begins. Think of this metric as your playbook for turning data into decisive, profitable moves. It tells you exactly where to focus your energy—whether you're dealing with slow-movers collecting dust or best-sellers flying off the shelves a little too quickly.
If your analysis reveals a high DOH, it’s a bright red flag that cash is trapped on your shelves. It’s time to get that inventory moving and convert it back into working capital you can use to grow the business.
When you're sitting on too much stock, the game is all about increasing sales velocity without completely torpedoing your margins. A few proven tactics I’ve seen work wonders:
On the flip side, a dangerously low DOH means you’re living on the edge. You're at constant risk of stocking out, which leads to lost sales, frustrated customers, and a damaged reputation.
For products with a low DOH, your priority shifts from selling to securing. It's all about tightening up your supply chain and getting smarter with your ordering process.
By syncing these DOH insights with your marketing calendar, you can strategically promote products with high inventory to free up cash while ensuring your bestsellers are always available for your loyal customers. This approach transforms your DOH from a simple, passive metric into an active, powerful management tool.
And if you want to really understand the financial impact, it helps to learn more about what inventory carrying cost is and see exactly how reducing your DOH directly lowers those hidden expenses.
Jumping into a new inventory metric like Days on Hand always brings up a few questions. Let's tackle some of the most common ones I hear from merchants who are just getting started.
There’s no single right answer, but a monthly calculation is a great starting point for most stores. This frequency gives you a relevant, timely snapshot of your inventory health without turning into a massive administrative chore.
That said, if you're in a fast-moving space like fashion or deal with perishable goods, you might want to tighten that up. Shifting to a bi-weekly or even weekly calculation can give you the agility you need to react to quick sales trends and sidestep costly problems like spoilage or dead stock.
The best cadence is the one you can actually stick to. A consistent monthly DOH calculation is far more valuable than a spotty, inconsistent weekly one. Consistency is what allows you to build a reliable baseline and spot the trends that matter.
Seasonality can send your DOH on a rollercoaster, and it's something you absolutely have to factor in.
Think about a toy store. Its DOH will naturally—and correctly—be much higher in October and November as it stocks up for the holiday rush. A high DOH in that context isn't a red flag at all; it's a strategic move.
To get a true read on your performance, don't just compare your DOH to last month. Compare it to the same period last year. This year-over-year view helps normalize for those seasonal spikes and dips, revealing how efficient your inventory management really is.
Ready to stop guessing and start making data-driven inventory decisions? Tociny.ai automatically calculates DOH for every single SKU, flags overstock risks before they become problems, and gives you clear, actionable recommendations to boost your bottom line. Join our private beta to get early access and personalized guidance. Learn more about Tociny.ai.
Tociny is in private beta — we’re onboarding a few select stores right now.
Book a short call to get early access and exclusive insights.