Calculating your safety stock means figuring out exactly how much extra inventory you need on hand to avoid the dreaded "out of stock" sign.You’re basically creating a buffer against sudden changes in customer demand or hiccups in your supply chain.
For most Shopify merchants, the simplest yet effective way to get a handle on this is the Average-Max method.
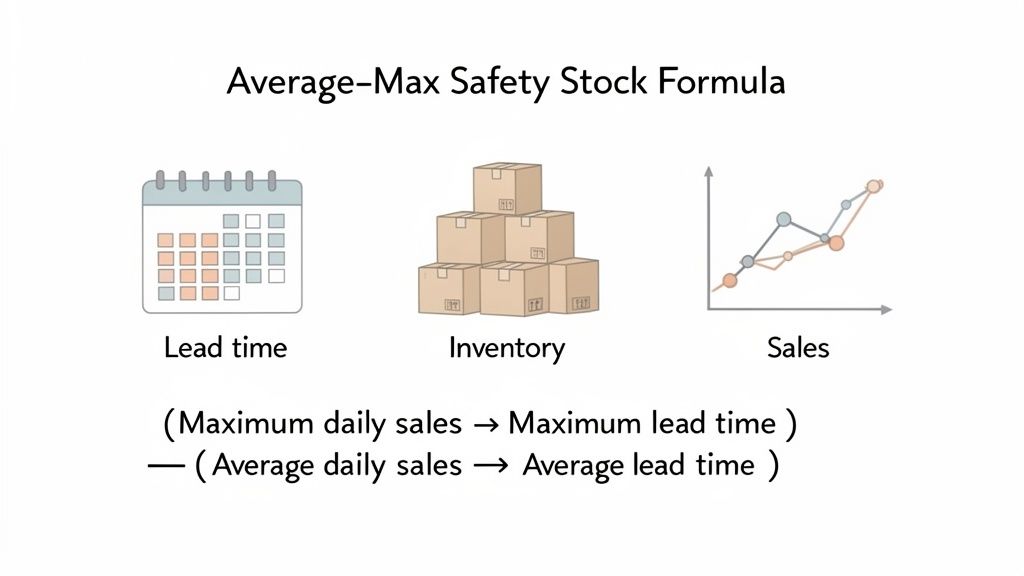
The formula looks like this: Safety Stock = (Maximum Daily Sales × Maximum Lead Time) – (Average Daily Sales × Average Lead Time). It strikes a great balance between being easy to calculate and providing a realistic buffer for the typical e-commerce hustle.
Let's be real—stockouts are a silent killer for any e-commerce brand. That "out of stock" notification isn't just a minor blip; it's you telling a customer to go check out your competitor.
Think of safety stock as your brand's insurance policy. It’s the extra inventory you intentionally hold to shield your business from two massive uncertainties: unexpected spikes in demand and frustrating supplier delays.
For anyone running a Shopify store, getting this right isn't just about operations. It's about building a brand that customers can rely on. A single stockout isn't just one lost sale; it can trigger a whole chain reaction of bad outcomes that can really sting your reputation and your bank account.
Picture this: your wellness brand’s new supplement suddenly goes viral on TikTok. Your sales explode from 50 units a day to 500. Without that safety buffer, you're sold out within hours. You've missed out on a ton of revenue and let down a wave of excited new customers. All that incredible momentum? Gone.
Or, imagine you run a fashion store and source your bestselling jacket from overseas. A sudden shipping snag adds two weeks to your lead time, right as the fall season kicks off. Without safety stock, that product page is a ghost town during its absolute peak sales window.
The real cost of a stockout is rarely just the value of the missed sale. It includes lost customer lifetime value, damage to your brand’s reputation, and the potential for negative reviews that deter future buyers.
These kinds of scenarios drive home a hard truth for direct-to-consumer brands: solid inventory management is a serious competitive advantage. It's how you protect your hard-earned reputation and make sure you're always there for your customers.
When you manage safety stock proactively, you can:
Picking the right way to calculate safety stock isn't about finding the most complex formula out there. It’s about matching the method to your business reality. Honestly, there's no single "best" answer. The ideal approach hinges entirely on your product's demand patterns, how reliable your suppliers are, and where your brand is in its growth journey.
Let's break down the three most practical methods for Shopify merchants. We’ll skip the dry academic theory and get straight to the stuff that works, helping you pick the formula that gives you the most confidence without overcomplicating your day-to-day operations.
Sometimes, the simplest method is genuinely the most effective. The fixed safety stock model is exactly what it sounds like: you set a predetermined number of units as your buffer for a specific product. For example, you might decide to always keep 50 extra units of your bestselling coffee blend on hand, no matter what.
This strategy works best for products with incredibly stable and predictable demand. If you're a newer D2C brand and your sales history is still short but consistent, a fixed amount can be a great starting point. It’s a breeze to implement and doesn't require any gnarly calculations. The major drawback, though, is that it’s static. It won't adapt to seasonality, sales trends, or those dreaded supply chain delays, making it a poor fit for products with fluctuating sales.
The Average-Max method is often the sweet spot for growing Shopify stores. It’s way more dynamic than a fixed quantity because it forces you to account for a worst-case scenario by looking at both your demand and lead time variability. This gives you a much more realistic buffer, especially for businesses whose sales aren't perfectly predictable—which, let's be real, describes most of us in e-commerce.
Think about a home goods store that sees a surge in blanket sales every autumn. They'd get far more value from this formula than a fixed amount. It allows them to build a larger buffer ahead of their peak season by using historical maximum sales and lead time data. It’s the perfect middle ground, offering a solid degree of protection without needing a degree in statistics. This calculation is a crucial first step before you even think about how to calculate the reorder point, as your safety stock level directly influences when you need to order more.
Choosing a formula isn't a permanent decision. Start with the method that best fits your current data and operational capacity. As your business grows and your data becomes richer, you can always graduate to a more precise, statistical approach.
For established brands that need a high level of precision, the statistical method using a Z-score is the gold standard. This approach uses the standard deviation of both your demand and lead time to calculate a buffer tailored to a specific desired service level—that’s just a fancy term for the probability you won't stock out. For instance, a 95% service level means you're accepting a 5% chance of stocking out.
This method is ideal for high-volume bestsellers where a stockout would mean significant lost revenue and seriously disappointed customers. It empowers you to make a conscious, data-backed trade-off between inventory holding costs and the risk of running out of stock.
This decision tree visualizes which formula might be the best fit based on your business's needs.
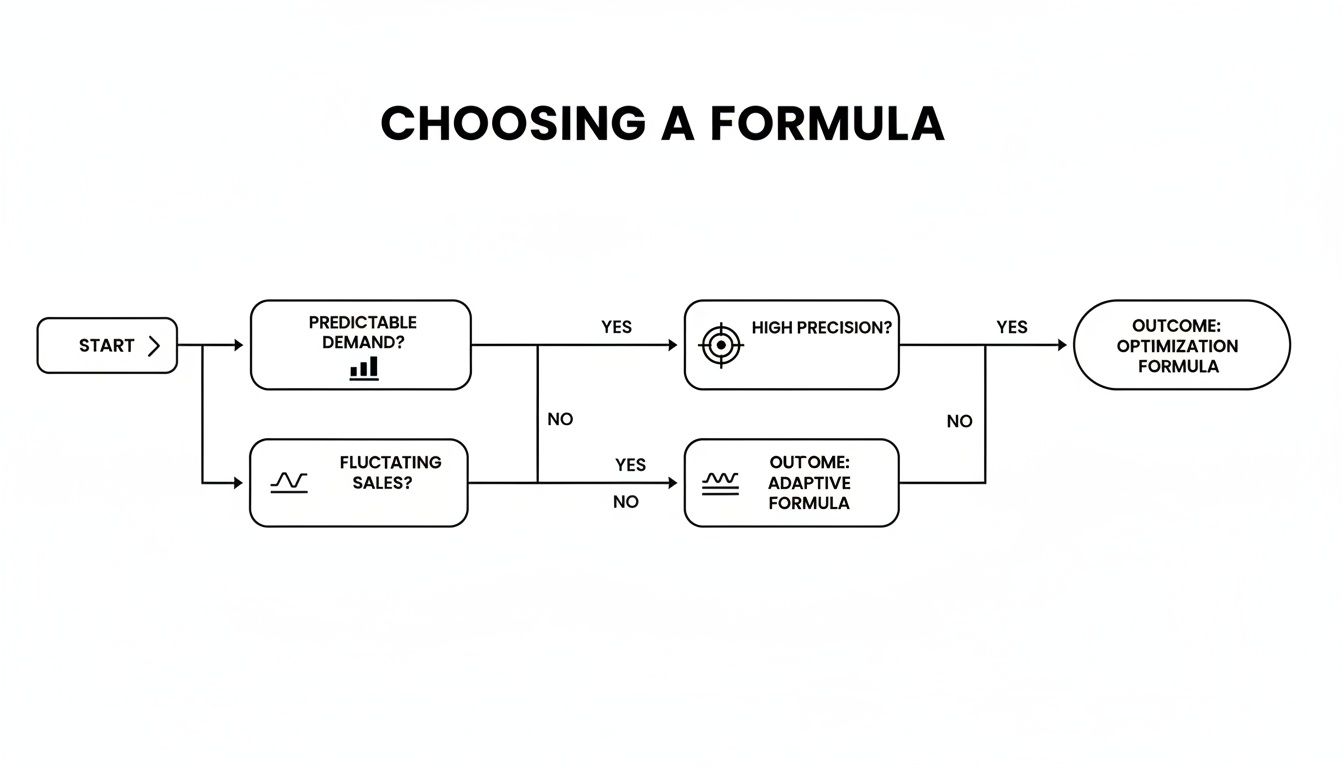
As the flowchart shows, the more your demand varies and the more precision you need, the more sophisticated your formula should be.
No matter which formula you choose, having accurate sales data is paramount. You can learn more about how to track a Shopify store's sales volume to get the right inputs for your calculations. At the end of the day, the best formula is the one you can actually implement consistently and accurately.
While some of the more complex statistical formulas offer pinpoint precision, I find that for most growing Shopify stores, the Average-Max method hits the sweet spot. It’s a perfect blend of simplicity and real-world effectiveness, giving you a reliable buffer against the classic ecommerce headaches: unexpected demand spikes and frustrating supplier delays.
Let's break down exactly how you can put this method to work.
The core idea here is to prepare your inventory for a "worst-case scenario" by calculating the gap between your maximum possible inventory needs and your average, everyday needs.
The formula looks like this:
(Maximum Daily Sales × Maximum Lead Time) – (Average Daily Sales × Average Lead Time)
What I love about this formula is that it forces you to account for variability from both sides of the equation—demand and supply. This creates a safety net that can handle a perfect storm when both go wrong at the same time.
Let's imagine you run a store selling consumer electronics. Your bestselling portable power bank is a consistent earner, but you've noticed that sales can surge during holiday travel seasons, and your supplier's shipping times are… let's just say, unpredictable.
To get the data you need, you’ll want to dive into your sales history and purchase orders from the last 3-6 months. The longer the period, the better the data, but that’s a good starting point.
Here are the numbers for your power bank:
Now, let's plug these values into the formula. We'll start with the "worst-case" scenario—the most you'd ever need to have on hand to cover a long delay and high demand.
1,800 units = 120 units (Max Sales) × 15 days (Max Lead Time)
Next, we'll calculate the "average" scenario, which is what you typically need.
800 units = 80 units (Avg Sales) × 10 days (Avg Lead Time)
Finally, just subtract the average from the worst-case to find your safety stock.
1,000 units = 1,800 units – 800 units
This means you should aim to hold 1,000 units of that power bank as a dedicated safety buffer. This isn't your regular reordering stock; it's the emergency stash that saves you from stockouts when sales pop off right as your supplier hits a snag. A well-organized inventory tracking sheet can be a huge help in keeping this safety stock level separate from your active inventory.
To illustrate this step-by-step, let's lay it out in a table.
This table walks through the exact calculation for our power bank example, showing how each piece of data fits into the final safety stock number.
| Variable | Definition | Example Value | Calculation Step |
|---|---|---|---|
| Maximum Daily Sales | The highest number of units sold in a single day. | 120 units | Used to calculate the worst-case demand. |
| Maximum Lead Time | The longest time it has taken for an order to arrive. | 15 days | Used to calculate the worst-case demand. |
| Average Daily Sales | The average number of units sold per day. | 80 units | Used to calculate the average demand. |
| Average Lead Time | The average time it takes for an order to arrive. | 10 days | Used to calculate the average demand. |
| Worst-Case Demand | Max Sales × Max Lead Time | 1,800 units | 120 × 15 = 1,800 |
| Average Demand | Avg Sales × Avg Lead Time | 800 units | 80 × 10 = 800 |
| Safety Stock | Worst-Case Demand – Average Demand | 1,000 units | 1,800 – 800 = 1,000 |
Seeing it broken down like this makes it clear how the formula isolates the extra inventory needed to protect against variability, not just fulfill normal orders.
Key Takeaway: The Average-Max method is all about preparing for that perfect storm—the highest possible sales hitting you during the longest possible supplier delay. It’s a pragmatic way to ensure you have enough inventory to weather the most challenging periods without tying up too much cash.
Look, nobody wants to do this math manually for every single product. The good news is you can automate this in seconds using Google Sheets or Excel.
Let's say you've organized your data in a spreadsheet:
Just pop this simple formula into a new cell, and you're good to go:
=(A2*B2)-(C2*D2)
This one formula turns a theoretical concept into a practical tool you can use right now. For Shopify merchants in fast-moving industries like fashion or consumer electronics, this method is especially valuable. It's designed to protect you against those extreme scenarios—high supply variation mixed with high demand variation—so you’re always covered.
Ultimately, this approach gives you a robust, easy-to-understand way to safeguard your bestsellers and keep customers happy, even when things don't go according to plan.
If the Average-Max method is about bracing for a worst-case storm, this statistical approach is like becoming a meteorologist—you’re not just preparing for the weather, you’re predicting it with a high degree of accuracy. For scaling brands, this level of precision isn't just a "nice-to-have." It’s a critical tool for protecting your most important products without tying up mountains of cash in inventory.
You don't need a Ph.D. in statistics to get the hang of this. At its core, this method simply moves beyond simple averages to account for the real-world randomness of customer demand and your supplier lead times. It all comes down to a few key ideas we can translate into plain English.
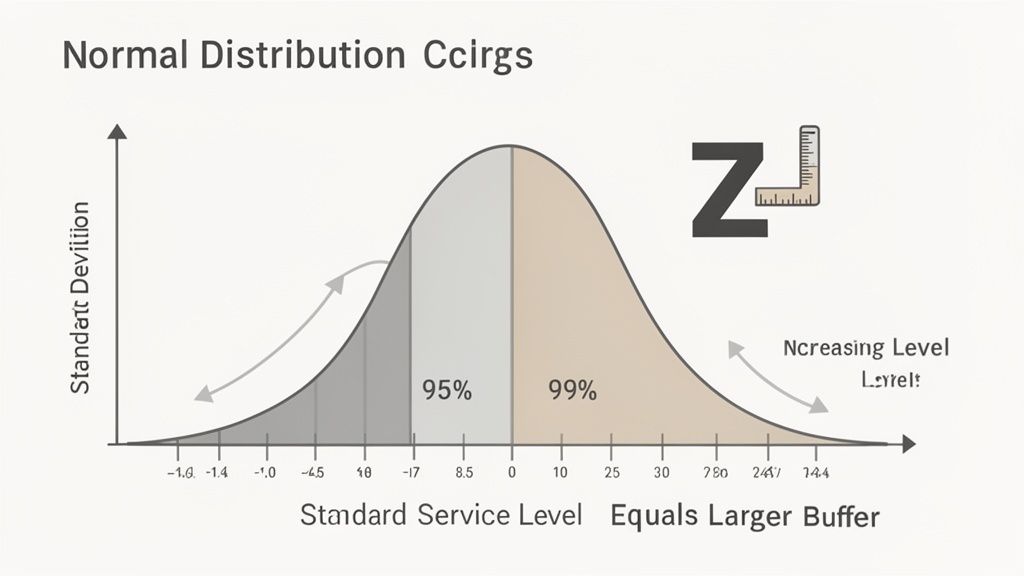
At its heart, this method is all about making a strategic trade-off. It’s built on the reality that you can't prevent 100% of stockouts without holding an infinite amount of inventory—something no business can afford. Instead, you get to choose a desired service level, which is simply the probability that you won't have a stockout.
Here’s what you’re working with:
To get the most accurate results, you'll need to calculate the average (or mean) of your historical demand or lead time data. If you need a hand with that, a simple mean calculator can be a useful tool.
Formulas that use standard deviation and Z-scores give you far more accuracy, which is essential for businesses managing complex or fast-moving inventories. The core formula looks a bit intimidating at first, but it's straightforward: Safety Stock = Z × σLT × D avg.
In this formula, Z is your Z-score, σLT is the standard deviation of your lead time, and D avg is your average demand.
Let’s say your brand wants to hit a 95% service level, which has a Z-score of 1.65. Your lead time demand deviation (σLT) is 50 units, and your average daily demand is 200 units.
Plugging that in, your safety stock would be 8,250 units (1.65 × 50 × 200).
This approach is so powerful because you're graduating from guesswork to calculated risk assessment. It’s an absolute game-changer when you start using tools for AI demand forecasting.
Key Insight: This method forces you to ask a crucial strategic question: "How much stockout risk are we willing to accept for this specific product?" For a hero SKU, you might aim for a 99% service level. But for a slower-moving item, 90% might be more than enough.
The service level you choose has a direct and significant impact on your inventory investment. That little jump from a 95% service level to 99% might seem minor, but it can require a huge increase in safety stock. Why? Because you're protecting your business against much, much rarer events.
Here's a quick reference table that makes this relationship really clear.
This table can help you visualize the trade-off between your desired service level, the corresponding Z-score, and the resulting probability of a stockout.
| Desired Service Level | Corresponding Z-Score | Probability of Stockout |
|---|---|---|
| 90% | 1.28 | 10% |
| 95% | 1.65 | 5% |
| 98% | 2.05 | 2% |
| 99% | 2.33 | 1% |
Looking at the numbers, you can see the trade-off in black and white. To cut your stockout risk from 5% down to just 1%, you need to increase your Z-score from 1.65 to 2.33. That translates to holding about 41% more safety stock for that item.
This is exactly the kind of analysis that helps you start making sharp, data-driven decisions that perfectly balance customer happiness with financial efficiency.
A formula gives you a number, but the real art of inventory management is in the strategy behind it. Knowing how do you calculate safety stock is only half the job. The other half is applying that knowledge with a sharp, financial mindset.
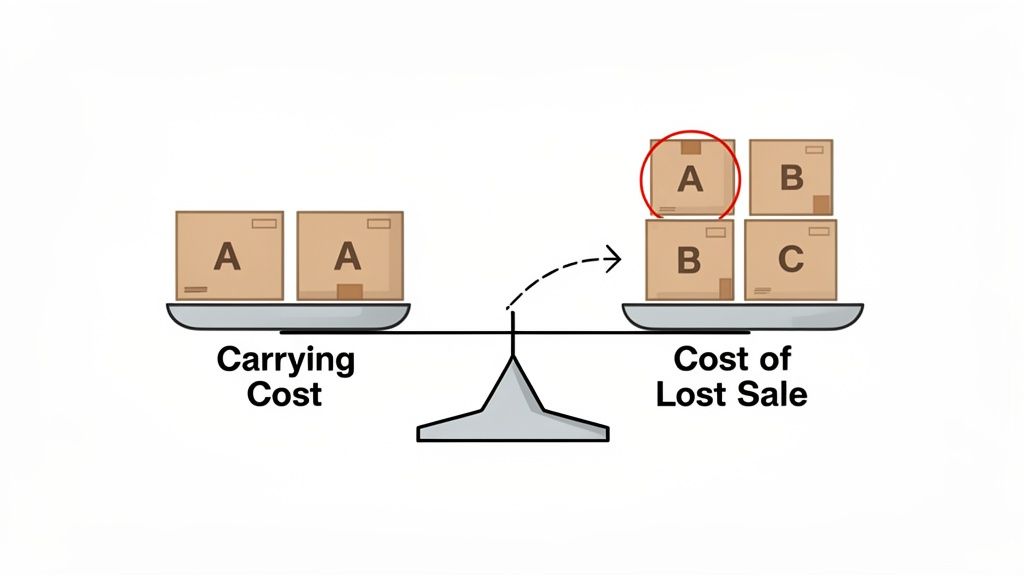
You have to think like a seasoned COO, constantly weighing the cost of holding inventory against the painful cost of a lost sale.
Holding too much safety stock ties up cash that could be fueling your marketing or product development. But hold too little, and you’re bound to frustrate loyal customers and tarnish your brand's reputation. The goal isn’t to prevent every single stockout—that’s an expensive fantasy. It’s about making smart, profitable decisions about which products deserve the most protection.
One of the most powerful ways to get strategic is with ABC analysis. It’s a classic for a reason. This method forces you to categorize your products based on their actual value to your business, not just your gut feelings.
Here’s how it breaks down:
This tiered approach ensures your inventory investment is working as hard as possible. It protects your most valuable assets without bloating your warehouse with dust-collecting stock.
The most common mistake merchants make is treating every product equally. Applying the same safety stock policy to your bestseller and your slowest-moving SKU is a recipe for wasted capital and missed opportunities.
For a more advanced strategy that bakes this cost-benefit analysis directly into the calculation, some turn to approaches like the McKinsey method. This comprehensive model integrates historical demand, carrying costs, and service level targets into a balanced optimization strategy, preventing over-investment in slow-movers while protecting bestsellers. You can explore different safety stock formulas to see how they compare.
Ultimately, remember that safety stock isn't a "set it and forget it" number. You have to revisit your calculations quarterly, at a minimum, especially after major sales events or before your peak season. Relying on stale data from six months ago is a fast track to wildly inaccurate buffers. By staying agile and strategic, you can turn a simple calculation into a powerful tool for profitable growth.
Once you get past the formulas, the real-world questions start popping up. Let's dig into the practical issues that Shopify merchants run into when they start putting safety stock into practice.
Safety stock is never a "set it and forget it" number. Your business is dynamic—demand shifts, suppliers change, and sales velocity fluctuates. Your safety buffer needs to keep up.
A good rule of thumb is to revisit your safety stock levels quarterly. But that's just a baseline. You should absolutely trigger an immediate recalculation after certain events:
This is where the art meets the science. Picking a service level is a strategic balancing act between keeping customers happy and managing your cash flow. Sure, a 99% service level sounds incredible, but the cost of holding that much extra inventory can be a killer.
The best approach is to segment your products using an ABC analysis.
Your "A" products—the top 20% of SKUs that drive 80% of your revenue—are the lifeblood of your business. These are the items you absolutely cannot afford to have out of stock. Protect them with a high service level, something like 98%.
For your slow-moving "C" products, a lower service level of 85-90% makes much more sense. It's far more cost-effective and frees up capital you can invest in your winners.
It's better to provide a 99% service level for your bestsellers than a mediocre 90% across your entire catalog. Focus your investment where it delivers the greatest financial return and protects the core of your business.
This is a common trip-up. When you have products with variants like size or color, you cannot calculate safety stock for the parent product. It just doesn't work.
Think about it: a "Medium Blue T-Shirt" is a unique SKU with its own sales history and demand pattern, completely separate from the "XL Red T-Shirt." You have to calculate safety stock for each individual variant.
Doing it this way prevents you from overstocking unpopular sizes just because the parent product sells well, while also ensuring your most popular variants are always ready for your customers.
Let's be honest, manually calculating and re-evaluating safety stock for every single SKU is a massive time-suck, especially when you have variants. This is where automation becomes a lifesaver. Tociny.ai uses AI to analyze your Shopify sales data, predict future demand, and automatically recommend the optimal safety stock for each product and variant, making sure you’re always prepared without the headache. You can find out more about how Tociny.ai works.
Tociny is in private beta — we’re onboarding a few select stores right now.
Book a short call to get early access and exclusive insights.