Demand forecasting techniques are simply the methods businesses use to predict how much of their stuff customers are going to buy. These can range from straightforward statistical models that look at past sales data to sophisticated AI-powered algorithms that chew on everything from market trends and promotions to big-picture economic factors.

Running an e-commerce brand can feel like you're captaining a ship through unpredictable seas. Without a reliable weather report, you could sail straight into a storm or get stuck in the doldrums with no wind. In this scenario, your inventory is the ship, and mastering demand forecasting is your advanced weather prediction system. It elevates you from pure guesswork to having a strategic map for the entire journey.
Get these predictions wrong, and the consequences are immediate and expensive. Underestimate demand, and you're hit with stockouts, sending frustrated customers right into the arms of your competitors. Overestimate, and you’re drowning in overstocked inventory, tying up precious cash in products nobody wants. For any direct-to-consumer (D2C) brand, this balancing act is a daily reality where small mistakes can snowball quickly.
Accurate forecasting is about so much more than just managing inventory—it ripples through your entire operation. When you can reliably predict what customers will buy and when, you unlock some serious competitive advantages.
The numbers don't lie. When one retail organization adopted an AI-driven forecasting system, they saw stockouts plummet by 72% and excess inventory shrink by 31%. Their forecast accuracy at the individual product level jumped from 67% to 91%, which translated to a $2.3 million drop in annual markdown losses. For a deeper dive, you can learn more about how historical data improves demand forecasting.
In a crowded market, the ability to anticipate demand isn't just a nice-to-have; it's a critical tool for survival. It allows you to be proactive instead of constantly reacting, steering your business toward profitability with confidence.
The stakes are high. The difference between getting forecasting right and getting it wrong can make or break a business. Let's look at a quick comparison to see what's really on the line.
| Business Area | Impact of Poor Forecasting | Benefit of Accurate Forecasting |
|---|---|---|
| Inventory | Frequent stockouts or crushing overstock, both driving up costs. | Optimized stock levels that meet demand without tying up cash. |
| Customer Service | High rates of backorders and a constant stream of customer complaints. | Increased customer loyalty and a much higher lifetime value. |
| Marketing | Wasted ad spend promoting items that are already out of stock. | Efficient campaigns perfectly timed with available inventory. |
| Finance | Unpredictable cash flow and razor-thin (or negative) profit margins. | Stable revenue streams and confident financial planning. |
As you can see, the impact spreads across the entire company. Investing in the right forecasting techniques isn't just an operational upgrade; it's a fundamental business strategy for any modern e-commerce brand.
Before we dive into the complex world of AI and machine learning, let's start with the basics. The classic statistical methods are the foundation of modern demand planning for a reason: they work. These techniques all start with your most valuable asset—your historical sales data. By looking at what you've sold in the past, you can start to build a logical picture of what you might sell in the future.
Think of your raw sales data like a jagged line on a chart, full of daily peaks and valleys. It's tough to see the bigger picture when you're zoomed in on the noise. Time-series models are designed to smooth out that jagged line, revealing the underlying trend and giving you a much clearer sense of direction. They're the perfect starting point for any e-commerce brand, especially for products with a relatively stable sales history.
The simplest way to start is with the moving average. This technique does exactly what it sounds like: it calculates the average sales over a recent window of time—say, the last 30, 60, or 90 days—and uses that number as the forecast for the next period. It’s a beautifully simple way to cut through the day-to-day chaos and see what's really going on.
Imagine you sell a popular skincare product. Your daily sales might jump around, but a 30-day moving average will smooth out those random spikes and dips, showing you a much clearer growth pattern.
Moving averages are a solid starting point, but they’re a bit like driving while only looking in the rearview mirror. They show you exactly where you've been, but they can't predict the big hill or sharp turn just around the corner. For that, you need something a bit more sophisticated. You can learn more about how these techniques fit into a broader strategy by exploring our guide on what is demand planning.
When you're ready to graduate to a model that doesn't just see the road behind you but also anticipates what's coming, you turn to methods like ARIMA (AutoRegressive Integrated Moving Average). It sounds intimidating, I know, but the core idea is pretty straightforward. ARIMA is just a more intelligent system that digs deeper into your sales history.
An ARIMA model doesn't just average out past sales. It actively looks for relationships between data points over time, allowing it to identify and project trends (the long hills), seasonality (the predictable yearly curves), and other repeating cycles in your data.
This makes ARIMA incredibly powerful for businesses with obvious seasonal products or clear growth patterns. Our skincare brand, for example, could use ARIMA to analyze sales spikes from previous years and accurately predict the holiday rush in Q4. These statistical models provide a truly reliable foundation for inventory planning. In fact, one manufacturing company that put these methods into practice achieved a 25% improvement in forecast accuracy, which helped them streamline production and slash excess inventory.
To help you choose the right starting point, here's a quick breakdown of these traditional methods.
| Technique | Best For | Key Limitation | Example Use Case |
|---|---|---|---|
| Simple Moving Average (SMA) | Products with stable, consistent demand and no strong trends or seasonality. | Slow to react to recent changes; can lag behind new trends. | Forecasting demand for a staple product like a basic white t-shirt. |
| Weighted Moving Average (WMA) | Products with stable demand but where recent sales are more relevant. | Still struggles with seasonality; requires choosing the right "weights." | A tech accessory that just got a positive review and is seeing a sales lift. |
| ARIMA | Products with clear trends, seasonality, or other cyclical patterns. | Requires more data and is more complex to set up and interpret correctly. | Predicting sales for sunscreen in the summer or Christmas decorations in winter. |
These traditional techniques offer a solid framework for getting started. They force you to look at your own data and understand the rhythms of your business. While they are just the beginning of the journey, mastering demand forecasting techniques for e-commerce will give you a powerful advantage.
While time-series models are fantastic for looking at your past sales to predict the future, they have a big blind spot. They’re great at telling you what will likely happen, but they can't tell you why. So, what happens when you want to know how a planned promotion, a price change, or a new marketing blitz will actually move the needle?
This is where causal models and regression analysis come into the picture. Think of these techniques as the detective work of forecasting. Instead of just looking at the sales history, they dig into the clues—the specific business levers you can pull—to understand cause and effect.
It's a simple idea, really. Your sales volume is the dependent variable (the outcome you want to predict). Things you control, like your marketing spend, discount levels, and even outside forces like a competitor’s big sale, are the independent variables (the clues). A causal model is what connects all those dots, showing you exactly how pulling one lever impacts your final sales number.
The goal here is to move beyond just seeing patterns and start truly understanding relationships. A regression model essentially builds a mathematical equation that spells out how each of your business actions influences sales.
For example, a regression model might find that for every $1,000 you pump into Google Ads, you sell an extra 50 units of a certain product. Or it might show that a 10% discount consistently produces a 30% sales lift while the promotion is live. All of a sudden, your business decisions are directly tied to your demand plan.
These models give you predictive power over your own actions. You can run "what-if" scenarios before committing your budget, creating a much more strategic approach to inventory and marketing alignment.
This is a game-changer for any brand that actively tweaks its strategy. It helps answer the critical questions that a simple time-series forecast just can’t touch.
By mapping out these relationships, you can prepare your inventory with surgical precision. You can confidently stock up for a huge promotion without getting stuck with a mountain of expensive overstock when it’s over.
Let's walk through an example. Imagine you run a fashion brand gearing up for a massive Black Friday sale. Your plan is to offer a steep 40% discount on all winter coats and back it up with a major ad spend.
Instead of just guessing how many to order, you use a regression model built on data from past sales events. The model crunches several variables:
The model spits out a clear forecast: based on your planned 40% discount and ad budget, you can expect to sell roughly 2,500 winter coats over the four-day weekend. That’s a world away from the 300 units you might sell in a normal week. Armed with this data-driven insight, you can place a confident PO with your supplier, schedule extra staff for your fulfillment center, and make sure your marketing message is perfectly aligned with your inventory plan.
While the classic forecasting models give you a solid foundation, they’re a bit like looking at the road through your rearview mirror. They rely on a handful of variables and a human’s ability to connect the dots. But what if you could analyze thousands of data points at once, uncovering subtle patterns no analyst or spreadsheet could ever spot?
This is where artificial intelligence (AI) and machine learning (ML) come in. It’s the next evolution of forecasting demand techniques.
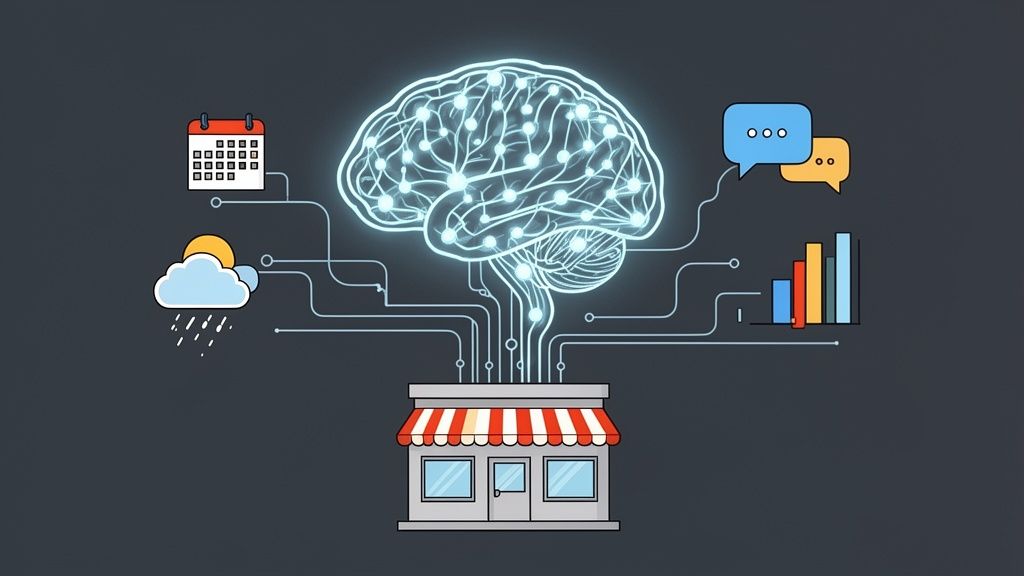
Think of it like having a team of thousands of data scientists working 24/7, exclusively for your store. That’s essentially what ML brings to inventory planning. These advanced algorithms are designed to chew through massive, complex datasets that are far beyond human capacity. They don’t just look at your sales history; they can analyze it alongside countless other signals in real-time.
An ML model can simultaneously process your past sales, active marketing campaigns, website traffic, and competitor pricing. But where it really shines is in its ability to layer in external factors that quietly influence your customers' buying habits.
The true magic of AI and ML is their knack for finding connections in seemingly unrelated data. These models can dynamically adjust their predictions as the world changes, giving you a level of precision older methods just can't touch.
Some of the variables an ML model can weave into its forecast include:
By crunching all this information together, ML models build a rich, multi-dimensional view of demand. They stop asking "What did we sell last year?" and start answering "Given everything happening right now, what will we sell next month?"
The biggest advantage of machine learning in forecasting is its ability to adapt. Unlike a static statistical model, an ML algorithm learns and course-corrects over time. With every new sale and every new piece of data, its predictions get sharper and more reliable.
Not long ago, these powerful forecasting demand techniques were siloed away in enterprise corporations with huge data science teams. The sheer complexity and computing power needed were out of reach for the typical Shopify merchant.
That’s no longer the case.
Modern inventory platforms have put this technology into the hands of every business owner. They do the heavy lifting—building the models, processing the data—behind the scenes and translate the powerful outputs into simple, actionable recommendations. For a Shopify merchant, this means you get all the benefits of a sophisticated AI engine without needing a PhD in statistics.
For example, an AI-powered platform can automatically analyze your product catalog and pick the best forecasting model for each individual SKU. It might use a simple time-series model for a stable, year-round seller but deploy a complex ML algorithm for a trendy item influenced by social media buzz. If you want to dive deeper into how these platforms work, check out our guide on AI demand forecasting tools.
This automation is what turns forecasting from a painful, time-sucking chore into a real strategic advantage. The system tells you which products are about to sell out, which ones are gathering dust, and exactly how much you need to reorder and when. It turns a mountain of data into clear directives, freeing you up to focus on what you do best: building your brand.
Let's be honest: not everything in your catalog is a predictable, steady seller. Most Shopify stores have those tricky products that throw a wrench into any standard forecast. We're talking about two main culprits: items with a dizzying number of variations and products that sell so rarely their demand looks completely random.
Your typical forecasting methods will fall flat here. You'll end up with stockouts in one size and a mountain of another, or worse, tying up cash in a product that just sits there for months. To get a real grip on your inventory, you need to bring in the specialists. Let’s look at two powerful techniques designed for these exact headaches.
Imagine you sell t-shirts. Trying to predict exactly how many red, size-large, v-neck t-shirts you’ll move in June is a shot in the dark. The sales data at that super-granular SKU level is often too thin and "noisy" to be reliable on its own.
This is where Hierarchical Forecasting flips the script. Instead of starting from the bottom, you start at the top of your product "family tree."
First, you forecast the total demand for your entire 'T-Shirts' category. This high-level prediction is almost always more stable and accurate because it's built on a much larger, more consistent pile of sales data.
Once you have that solid top-line number, you work your way down.
This top-down logic smooths out the wild fluctuations you see at the individual SKU level. It ensures your total investment in t-shirts is sound, helping you build a smarter, more balanced assortment that actually matches how people shop.
Now for the other big challenge: products that sell in fits and starts. Think of expensive custom furniture, specialized replacement parts, or high-end luxury items. You might sell a few units one week, then radio silence for the next month. A forecasting model looking for a steady trend will be completely lost.
Forecasting these products is like trying to predict a few random rain showers in a month of sunny days—you can't use the same tools you'd use to predict a consistent drizzle. For these "lumpy" or sporadic demand patterns, you need a specialized model like the Croston Method.
The Croston Method is a forecasting technique built specifically for items with intermittent sales. It smartly separates the forecast into two questions: when will the next sale happen, and how big will it be?
Instead of trying to guess a sales number for every single day (which would mostly be zero), the Croston Method calculates two things:
By combining these two pieces of the puzzle, you get a much more realistic forecast. This approach saves you from two costly mistakes: holding zero stock and missing a rare but valuable order, or tying up precious cash in inventory that gathers dust for months. It’s a game-changer for managing those tricky long-tail products with confidence.
Knowing the theory is one thing, but actually turning these forecasting techniques into a repeatable process is where the real money is made. You need a structured workflow. It's what turns forecasting from a reactive, hair-on-fire chore into a strategic, forward-looking habit for your business.
It all starts with clean, reliable data. Before you even think about running a model, you have to centralize and scrub your sales history. That means getting rid of anomalies like one-off bulk orders or data entry mistakes that could throw off your entire prediction. Once you trust your data, you can move on to picking the right forecasting models for different products and setting a regular schedule—maybe weekly for your fast-movers and monthly for the steady sellers.
Let's be honest: a forecast is only useful if you know how accurate it is. The final, and arguably most important, step in your workflow is creating a feedback loop. This just means you consistently compare what you thought would happen with what actually happened.
You don't need overly complex math here. A couple of simple but powerful metrics will become your best friends:
By tracking these metrics over time, you build a system of continuous improvement. When a model's accuracy starts to dip, you have a signal to investigate why and make adjustments. Your forecasting gets sharper with every single cycle.
This process often involves breaking down demand from a high level down to the nitty-gritty, just like this infographic shows.
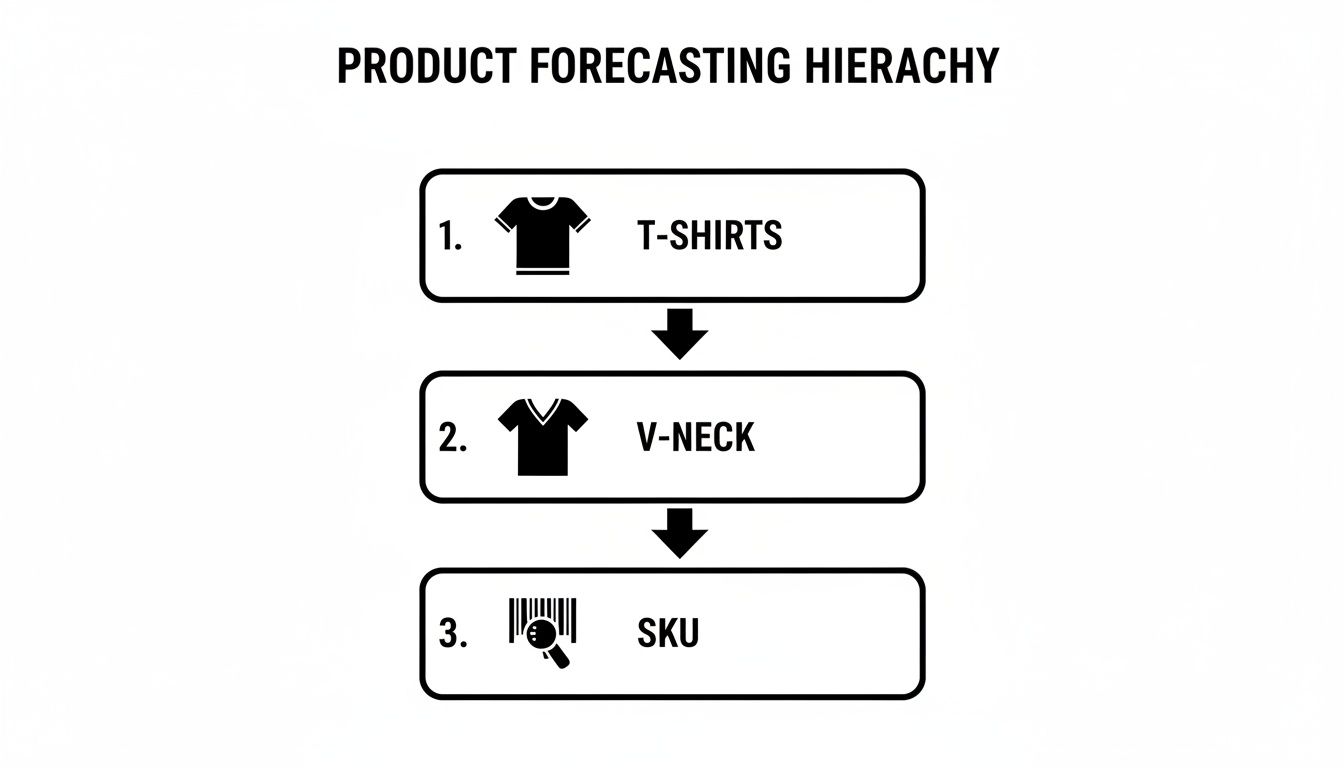
You can see how a forecast might start at a broad category ('T-Shirts'), get narrowed down to a sub-category ('V-Neck'), and finally be assigned to a specific SKU.
Trying to run this entire workflow by hand in a spreadsheet can become a nightmare, especially as your business and product catalog grow. This is where modern AI platforms really come into their own. They can automate the whole nine yards—from cleaning the data and picking the best model to tracking performance and spitting out exact reorder recommendations. For a deeper dive, our guide to demand forecasting software has you covered.
As you build out your workflow, you also have to keep an eye on platform-specific changes, like the ever-shifting rules for FBA forecasting for restock limits. An automated system helps you manage these outside forces, turning a mountain of complex data into clear, actionable inventory decisions. This frees you up to do what you do best: scale your brand.
Even with a solid grasp of forecasting techniques, a few practical questions always seem to pop up. Let's tackle some of the most common ones we hear from Shopify merchants to clear up any lingering confusion.
While there's no magic number, a good rule of thumb has always been at least two years of clean sales data. That’s typically enough history for a model to spot meaningful seasonal patterns (like holiday rushes) and get a sense of your long-term growth trajectory.
That said, modern AI-powered platforms can often work with much less. It's not uncommon for them to generate a surprisingly reliable forecast with as little as six months of history, which is a game-changer for newer brands.
Forecasting for a product that has never existed is definitely tricky, but it's far from impossible. You just have to get a bit more creative. The classic approach is to use qualitative techniques, like analyzing the sales of a similar or "look-alike" product you already sell. Think of it as finding a proxy. Early market research and pre-launch survey data can also give you some valuable clues.
This is an area where AI models really shine. They can analyze product attributes—like category, price point, color, or material—to estimate potential demand by comparing the new item to the historical performance of similar products in your catalog.
The right answer here completely depends on your business. There's no one-size-fits-all schedule.
For fast-moving consumer goods with a high sales velocity, you'll probably want to run a weekly or bi-weekly forecast. This keeps you nimble and allows you to react quickly to what the market is doing.
On the other hand, for products with longer manufacturing lead times or more stable, predictable demand, a monthly forecast is often more than enough. The most important thing is to pick a cadence, stick with it, and then adjust as you start tracking how accurate your forecasts are over time.
Ready to stop guessing and start growing? Tociny.ai replaces complex spreadsheets with an AI-powered inventory analytics platform that gives you clear, actionable recommendations. Get the visibility you need to reduce stockouts, eliminate overstock, and plan your inventory with confidence. Join our private beta for early access and see how we can help your Shopify store thrive.
Tociny is in private beta — we’re onboarding a few select stores right now.
Book a short call to get early access and exclusive insights.