Inventory forecasting is all about looking at past sales data and market trends to make a really good guess about what customers will want to buy in the future. It helps you keep just the right amount of stock on hand. These methods can be as simple as looking at your recent sales, or as complex as using AI-driven models to analyze dozens of factors at once. The goal is always the same: don't overstock, and don't run out of your bestsellers.
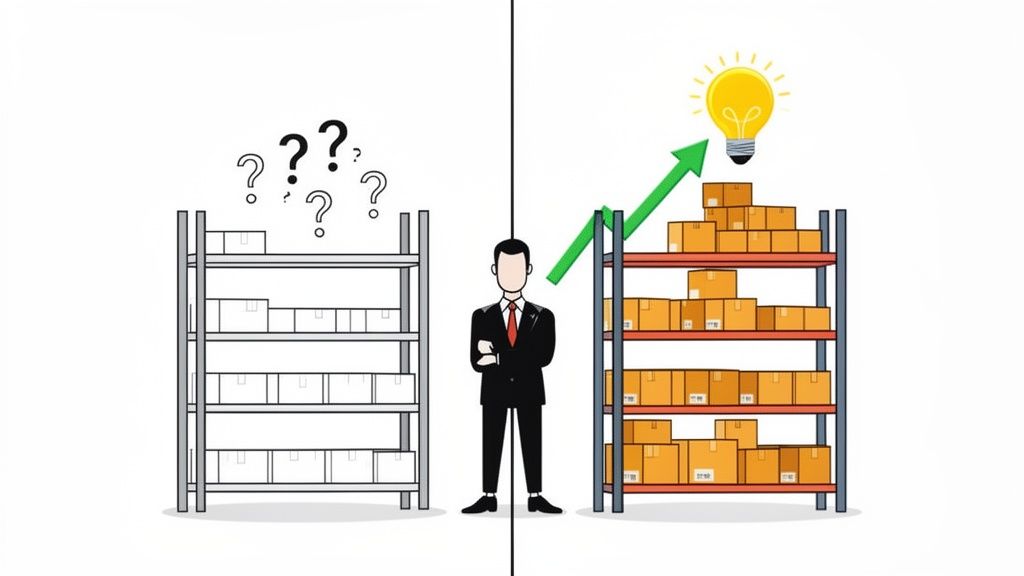
Every ecommerce owner knows that awful feeling of getting inventory wrong. You’re either staring at a warehouse full of products that aren't selling, tying up your cash, or you're scrambling to restock a hot item that flew off the shelves, leaving sales on the table. This isn’t just a minor headache; it’s a direct hit to your bottom line.
This guide is here to cut through the noise. We're going to reframe inventory forecasting from a complicated, academic exercise into a practical tool you can use to grow your business. Think of it as building a detailed roadmap for your future demand—turning raw data and market signals into decisions you can actually act on.
Getting your forecast wrong is expensive. Really expensive. In the world of retail and e-commerce, poor inventory management cost businesses a staggering $818 billion last year from problems like overstocking and stockouts. That number alone shows how critical good forecasting is. The good news? Even basic methods that lean on historical data have been shown to slash those errors by 20–50%. You can discover more insights about improving demand forecasting on forthcast.io.
We'll walk you through the essential forecasting methods, from the ground up, so you can build a solid foundation for making smarter, more profitable decisions.
The Goal of Forecasting: To align your inventory with customer demand as closely as possible, minimizing waste and maximizing sales opportunities. It's about having the right product, in the right quantity, at the right time.
We'll start with the basics and work our way up to more advanced techniques, showing you how to pick the right approach for your specific business. You'll also see how modern AI platforms like Tociny.ai make this kind of precision possible for everyone, not just huge corporations with teams of data scientists.
Mastering these concepts will help you: * Reduce costly stockouts that frustrate customers and hurt your brand. * Minimize overstock that eats up your working capital. * Improve cash flow by making much smarter purchasing decisions. * Increase profitability by turning your inventory over more efficiently.
Before you can run, you have to walk. The same is true for inventory forecasting. Before diving into complex AI algorithms, it’s crucial to get a handle on the foundational methods that every other technique builds upon. Think of these as the essential building blocks for your entire forecasting strategy.
These core models generally fall into two camps: qualitative and quantitative.
Qualitative forecasting is what you turn to when you have no historical sales data to work with. It relies on human judgment, expert opinions, and market intelligence instead of hard numbers. This makes it perfect for launching a brand-new product or expanding into a market where your past performance offers zero clues.
Quantitative forecasting, on the other hand, is all about using your past data to predict the future. This approach works on a simple but powerful principle: your past sales patterns hold the keys to what’s coming next. For most established businesses, this is the natural starting point.
Qualitative methods are definitely more of an art than a science. They’re about gathering insights from different sources to piece together an educated guess about future demand.
Common qualitative techniques include:
While they aren’t as precise, these methods are indispensable when you’re flying blind without data. They give you a strategic direction and help set those initial inventory levels for untested products. The key is to treat these forecasts as a starting point—one you’re ready to adjust as soon as real sales data starts rolling in.
Time series analysis is the absolute cornerstone of quantitative forecasting. It’s all about analyzing data points collected over time to spot trends, recurring patterns, and seasonality. Statistical forecasting, which includes time series analysis, is one of the most reliable ways to predict future demand.
The more historical data you have, the more dependable these methods become. Believe it or not, these techniques have been around since the mid-1800s, when the first basic statistical predictions were made long before computers. You can read more about the history of statistical forecasting to see how far we've come.
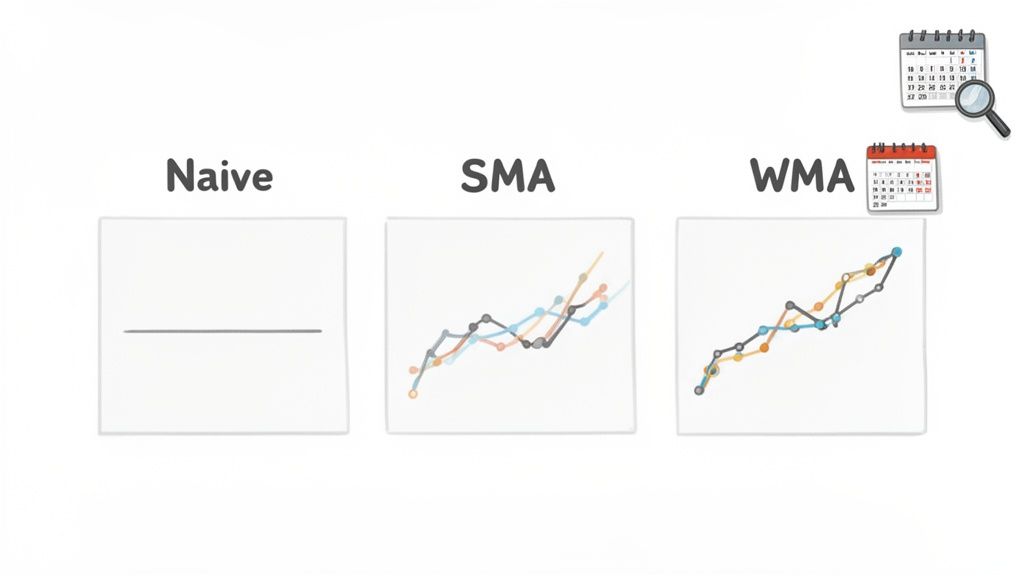
Let's break down three of the most common and straightforward time series models.
The Naive Method is the simplest forecasting model you can find. It operates on one basic assumption: sales in the next period will be exactly the same as sales in the most recent period. If you sold 100 units last week, you forecast 100 units for this week. It’s that easy.
Example: Your Shopify store sold 75 bags of your bestselling "Sunrise Blend" coffee last month. Using the Naive method, you forecast that you will sell another 75 bags next month.
This method is surprisingly effective for products with very stable, non-seasonal demand. Its biggest plus is its simplicity, but it can't see trends or seasonality coming, which makes it a risky bet for growing or fluctuating businesses.
A Simple Moving Average (SMA) helps smooth out the short-term noise in your sales data to reveal the real underlying trend. It works by calculating the average demand over a specific number of recent periods, like the last three months.
To get the SMA, you just add up the sales for your chosen period and divide by the number of periods. This average "moves" forward as new data comes in, always looking at the most recent window of time.
The Weighted Moving Average (WMA) is a smarter, more intuitive version of the SMA. It also calculates an average over a set period, but it gives more weight to the most recent data. This is based on the logical idea that what happened last week is probably a better predictor of the future than what happened three months ago.
For example, you might assign a weight of 50% to last month's sales, 30% to the month before, and 20% to the one before that. This makes your forecast much more responsive to recent shifts in customer behavior.
Deciding where to start can feel overwhelming, but for these basic models, it really comes down to your product's sales behavior and how much data you have on hand. This table breaks down which foundational method might be the best fit for you.
| Method | Best For | Key Weakness | Example Use Case |
|---|---|---|---|
| Naive Method | Products with extremely stable, flat demand and very little historical data. | Completely blind to trends, seasonality, or any sales fluctuations. | A new subscription product where you assume this month's subscriber count will be the same next month. |
| Simple Moving Average (SMA) | Products with some volatility, where you want to smooth out random spikes or dips to see a general trend. | Lags behind new trends because it gives equal weight to old and new data. | Forecasting sales for a popular t-shirt that has consistent but slightly noisy sales week-to-week. |
| Weighted Moving Average (WMA) | Products where recent sales performance is a much better indicator of future demand. | Requires you to decide on the weights, which can be subjective if not tested. | Forecasting demand for a trending gadget where last month’s sales are far more relevant than sales from six months ago. |
Ultimately, choosing between these foundational models depends on your specific sales patterns. By starting here, you build a solid forecasting base. Once you master these, you'll be in a much better position to explore and appreciate the power of more advanced models.
Alright, once you've got the basics down, it's time to roll up our sleeves and get into the more powerful stuff. We're moving beyond the simple averages and into advanced statistical forecasting. These are the models you bring in when your store has a bit more history and your sales patterns aren't just a straight line.
Think of it like this: the foundational methods are your trusty hand tools. They're great for simple jobs. But these advanced methods? They're the power tools. They’re built to handle more complexity, factoring in things like trends, seasonality, and other quirks that drive your real-world demand. For any growing Shopify store, making this leap is how you start getting really sharp with your inventory.
If the Weighted Moving Average was a step up from a simple average, then Exponential Smoothing is a giant leap. It works on the same core idea—giving more weight to recent data—but it's way more elegant about it. Instead of you manually picking the weights, this method uses a "smoothing factor" to automatically dial down the influence of older data points.
This means last month's sales have the biggest say, the month before has a little less, and so on, with the importance fading out smoothly. It keeps your forecast incredibly responsive to what's happening now without letting a random sales spike from six months ago throw everything off course.
While Exponential Smoothing is busy reacting to recent wiggles in your sales data, Trend Projection is all about the big picture. Imagine drawing a "line of best fit" straight through your historical sales chart—that’s essentially what this method does. It helps answer the big question: "If we keep growing like this, where will we be in a year?"
By mathematically finding that core growth trajectory, you can project demand much further into the future than you could with simple averages. It’s a fantastic tool for bigger strategic moves, like planning long-term purchase orders, figuring out warehouse space, and managing your cash flow.
For instance, if your sales have consistently climbed by 5% every quarter for the past two years, Trend Projection will lock onto that growth rate. It then uses it to sketch out a reliable forecast for your future inventory needs.
Okay, now we're getting into the heavy hitters. The name ARIMA (AutoRegressive Integrated Moving Average) sounds like something out of a statistics textbook, but the idea behind it is pretty intuitive. ARIMA is a powerhouse that basically acts like a detective, combing through your sales history for clues.
It cleverly combines three different analytical angles:
By blending these three components, ARIMA can get a handle on some seriously complex sales patterns. It's a true workhorse of classic statistical forecasting for a reason.
As solid as ARIMA is, it can sometimes be a bit rigid. That’s where Prophet comes in. Developed by the data science team at Facebook, Prophet was built from the ground up to deal with the kind of messy, real-world data that every ecommerce business has.
Prophet is an absolute game-changer because it’s designed to handle the exact things that make other models stumble:
Because it's so flexible and user-friendly, Prophet has quickly become a favorite for online sellers. If your store deals with seasonal demand, promotional events, or just has less-than-perfect data, this model can give you a massive boost in accuracy.
While time series models are great at spotting patterns in your own sales history, they have a major blind spot—they can’t tell you why those patterns are happening. This is where the next generation of inventory forecasting comes in. We're shifting from just looking at what happened to understanding the forces that drove those sales.
This advanced approach recognizes that your sales don't happen in a vacuum. They're influenced by a whole web of internal decisions and external market shifts. Causal models and AI-powered systems are built to untangle this complexity, delivering a level of foresight that traditional methods just can't touch.
Imagine trying to predict the weather by only looking at yesterday's temperature. You might get it right sometimes, but you'd miss every single storm rolling in. Causal models are the difference between that and full-blown meteorology; they factor in all the external elements that actually create the weather.
Instead of just looking at past sales numbers, these models connect demand to its root causes. The result is a much stronger, more realistic forecast that actually adapts to what you're doing in your business.
Key inputs for causal models often include:
By mapping out these relationships, you can start running "what-if" scenarios. For example, a causal model could predict the sales bump you'd see from increasing your ad budget by 15%, turning forecasting from a guessing game into a strategic planning tool.
The logical next step from causal modeling is the world of Artificial Intelligence and Machine Learning (ML). If causal models are like skilled meteorologists, then AI models are the supercomputers running thousands of global weather simulations at once. They can chew through enormous datasets and find incredibly complex, non-linear patterns that no human—or traditional model—could ever spot.
This is where the real power of modern forecasting is today. The leap from old-school stats to deep learning has completely changed the game for inventory management, allowing supply chains to handle wild demand swings with accuracy we could only dream of before. While older methods laid the foundation, the explosion of data has let AI take the lead, processing countless signals that go way beyond simple sales history.
Let's break down two of the most powerful AI methods used in inventory forecasting.
Think of a Gradient Boosting Machine as a team of specialists working together. It starts by building a simple, initial prediction. Then, it looks at where it went wrong and builds a new model focused specifically on fixing those mistakes. It repeats this process hundreds or thousands of times, with each new model "boosting" the accuracy of the whole team. This iterative approach makes GBMs incredibly good at handling the messy, mixed data common in ecommerce—everything from sales numbers to product categories.
LSTMs are a special kind of neural network built to understand sequences and time. They have a form of "memory" that lets them recall important information from the distant past while they process new data. This makes them perfect for spotting complex seasonal cycles or long-term trends that other models might miss, especially for brands with years of sales history.
These advanced AI models aren't just for data scientists anymore. They're the engines running modern inventory planning platforms. Solutions like Tociny.ai automate this entire complex process, turning countless data points into a clear competitive edge—no PhD required. For a deeper dive, you can learn more about how AI is reshaping demand forecasting in our other article.
To see how these powerful models are becoming more accessible for online merchants, it's helpful to understand the broader trend of leveraging AI apps for Shopify stores. This context shows how you can move beyond simply reacting to stock levels and start proactively anticipating what your customers will want next.
Picking the right inventory forecasting method feels a lot like choosing the right tool from a giant toolbox. You wouldn't use a sledgehammer for a finishing nail, right? The goal isn’t to find one magical "best" method, but to pick the one that fits your specific business situation right now. The right choice really boils down to a few honest questions about your data, your products, and your market.
This is a strategic decision. You have to take a hard look at your operational maturity, how predictable your sales are, and the resources you have on hand. A brand-new store launching its first product has completely different forecasting needs than a seasoned retailer with years of holiday sales data.
The flowchart below lays out a decision tree to help you visualize this selection process. It all starts with your data and branches out based on the external factors that sway your sales.
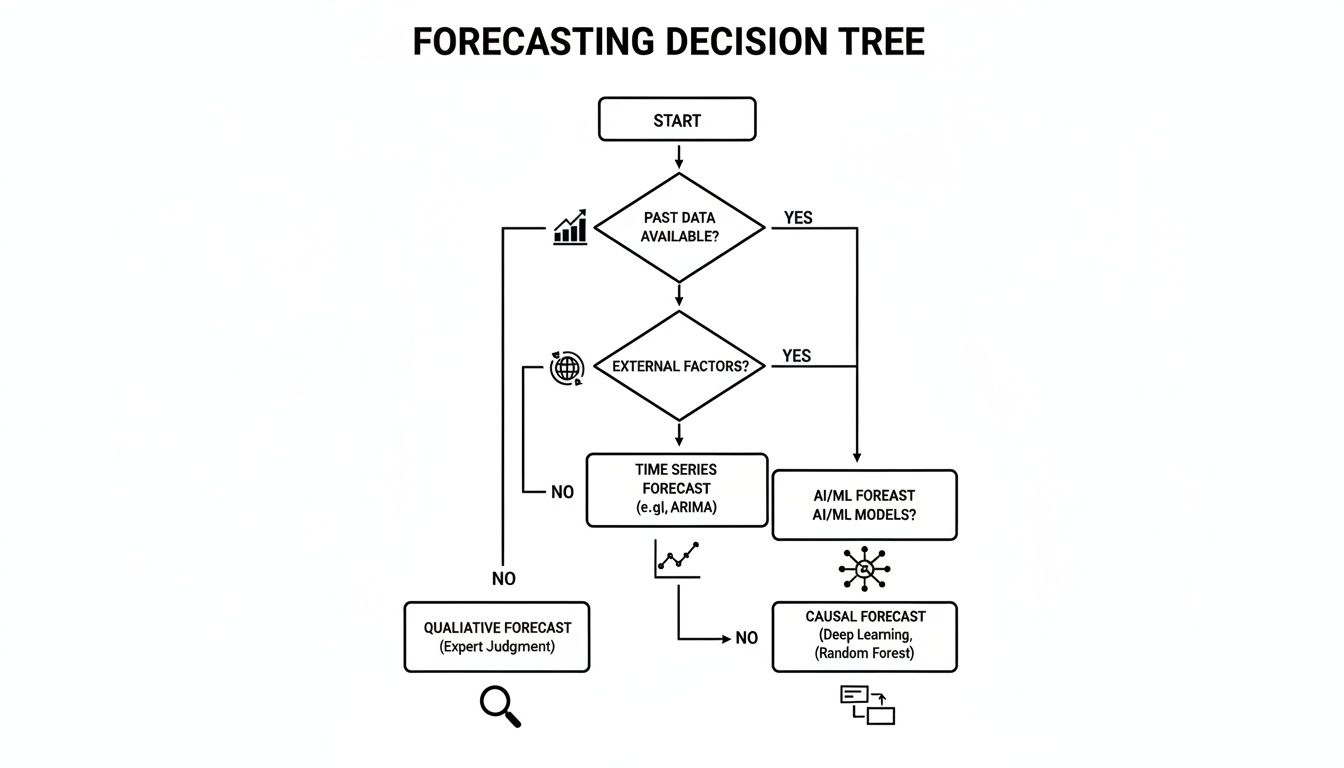
As you can see, the journey begins with your sales history. If you're short on data, qualitative methods and simple models are your go-to. As your data library grows and outside factors become more important, you'll need to graduate to more advanced statistical and AI-driven models to stay accurate.
Your data is the single most important factor. How much historical sales info do you have, and how clean is it?
Less than 6 months of data: Welcome to the qualitative forecasting zone. Without a solid sales history, you’ll be leaning heavily on market research, expert opinions, and educated guesses. Simple models like the Naive method can offer a temporary baseline once the sales start trickling in.
6-24 months of data: Now we're talking. You can confidently start using foundational time series models. A Simple or Weighted Moving Average is perfect for spotting early trends. If you're seeing steady growth, something like Exponential Smoothing will give you a more responsive and accurate forecast.
2+ years of data: This is where the real power is unlocked. With at least two full seasonal cycles under your belt, you can accurately deploy heavy-hitters like Prophet or ARIMA to nail down seasonal peaks and valleys. This is also where AI and machine learning models start to shine, uncovering complex patterns you'd never spot otherwise.
Next up, think about the personality of your products. Are your sales steady and predictable, or do they jump around like crazy?
A good way to approach this is to group your products:
Finally, how much do outside forces mess with your sales? If your demand is heavily influenced by promotions, ad campaigns, or what your competitors are doing, you’ve probably outgrown basic time series models.
This is the point where Causal Models and AI-powered platforms become game-changers. They can connect the dots between your marketing spend and a sales lift, or predict how a competitor's flash sale will impact your own demand—insights that are flat-out impossible to get from historical sales data alone. Exploring different types of demand forecasting software can give you a better idea of which tools are built to handle this level of complexity.
To pull this all together, here’s a quick decision matrix. Use it to find the best forecasting approach based on your business stage, data, and product types.
| Business Scenario | Data Availability | Recommended Method(s) | Why It Works |
|---|---|---|---|
| New Shopify Store Launch | Less than 6 months | Naive, Judgmental | With no historical data, these methods rely on market research and expert intuition as a starting point. |
| Growing Store with Steady Sellers | 6 - 24 months | Moving Average, Exponential Smoothing | These models are great for identifying early trends and smoothing out noise in a growing dataset. |
| Established Store with Seasonal Products | 2+ years | Prophet, ARIMA, Seasonal Decomposition | These advanced models are specifically designed to capture and predict recurring seasonal patterns. |
| Running Frequent Marketing Campaigns | 1+ year (including promo data) | Causal Models, Machine Learning (GBMs, LSTM) | These methods can correlate external factors like ad spend with sales demand for more precise forecasts. |
| Rapidly Scaling with a Large, Diverse Catalog | 2+ years (varied products) | Ensemble Methods, AI Platforms (like Tociny.ai) | Combines multiple models to handle different demand patterns across a wide range of SKUs automatically. |
Choosing the right forecasting method is an ongoing process, not a one-time decision. As your business grows and your data becomes richer, you'll want to revisit your toolkit and upgrade to more sophisticated methods to keep your inventory perfectly aligned with customer demand.
A perfect forecast is just a number on a spreadsheet until you do something with it. The final—and most critical—step in any of the inventory forecasting methods we’ve covered is translating that prediction into a profitable decision. This is where the magic happens, turning demand forecasts into smart purchase orders and strategic inventory plans.
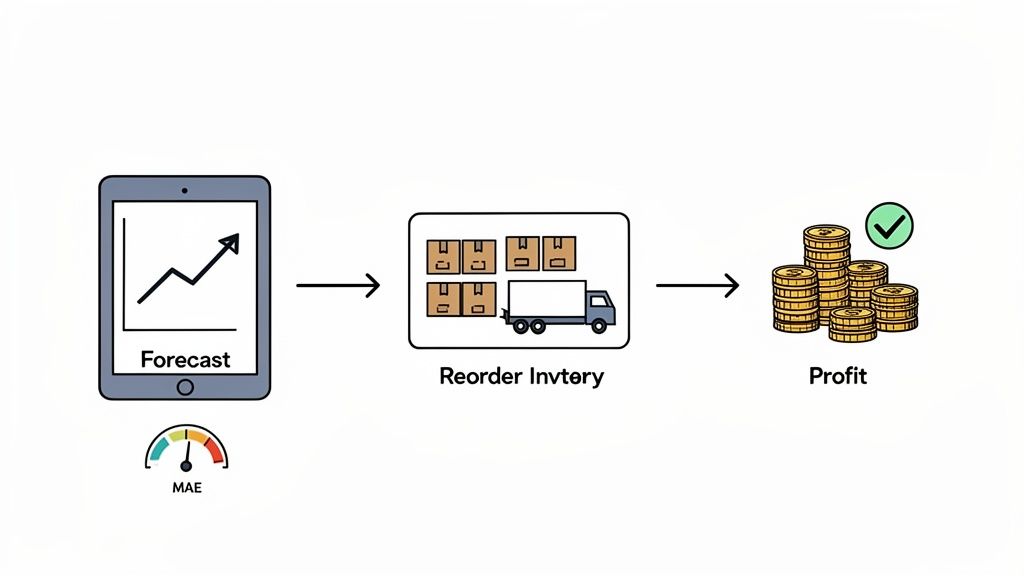
But the process doesn't stop when you hit "send" on an order. You have to keep score. Constantly measuring your forecast's performance is the only way to get better. A simple metric like Mean Absolute Error (MAE), which tells you the average size of your forecasting mistakes, gives you a clear benchmark to beat. This feedback loop is what separates good forecasting from truly great inventory management.
This is where a modern inventory platform becomes an action engine, not just a fancy calculator. It's designed to bridge the chasm between complex data and the simple, profitable decisions you need to make for your business.
Instead of just spitting out a demand number, these tools give you clear, straightforward recommendations:
This shift turns forecasting from a reactive chore into a proactive strategy. It’s no longer about just guessing what the future holds; it’s about actively shaping it to kill stockouts, slash overstock, and drive real growth.
Tools like Tociny.ai automate this entire workflow. They don’t just show you the data; they tell you exactly what to do with it. This ensures every forecast you run leads directly to a smarter, more profitable action. To dig deeper into building a resilient inventory strategy, check out our guide on how to calculate safety stock.
Even after you get the hang of different inventory forecasting methods, a few practical questions always pop up. Here are some quick answers to the things we hear most often from Shopify merchants.
This really depends on the forecasting method you’re using. For the simpler time series models, like a moving average, you can often get a decent starting point with just three to six months of sales history.
But when you step up to more sophisticated models like Prophet or ARIMA, which are built to spot yearly patterns, you’ll want at least two full years of data. Having that much history is what allows the algorithm to tell the difference between true seasonality and just a random spike in sales, giving you a much more reliable forecast.
This is a great question, and the distinction is super important. Think of them as two sides of the same coin, but they serve different purposes.
Inventory forecasting is the math part. It’s the technical process of digging into your data to predict what future sales will look like for specific products. It answers the question, "What are customers likely to buy?"
Demand planning is the business strategy that takes that forecast and runs with it. It folds in other crucial details like upcoming marketing campaigns, potential supply chain hiccups, and your company's bigger financial goals. Forecasting tells you what might happen; planning is deciding what you’re going to do about it.
Not only can you, you absolutely should. This is where smart inventory management really shines.
Your top-selling, most predictable products might do perfectly fine with a straightforward model like exponential smoothing. It's simple, effective, and gets the job done for stable demand.
Meanwhile, those super seasonal items—like holiday decor or summer apparel—will get a much more accurate prediction from an advanced model like Prophet that's designed to handle those big swings. And for brand-new products with zero sales history? A qualitative or judgmental forecast is really your only move. Using a blended approach, where you match the method to the product’s unique demand pattern, is always going to give you the best results.
Ready to stop guessing and start making inventory decisions with confidence? Tociny.ai uses AI to deliver clear, actionable forecasts and recommendations built specifically for Shopify stores. Eliminate stockouts and slash overstock by seeing what’s coming next. Get early access to Tociny.ai today.
Tociny is in private beta — we’re onboarding a few select stores right now.
Book a short call to get early access and exclusive insights.