
An inventory sheet is your business's single source of truth for every single product you have in stock. It’s a foundational document—usually a simple spreadsheet in Excel or Google Sheets—that itemizes everything you own, helping you track stock levels and overall value. This is a non-negotiable tool for any serious merchant looking to prevent costly errors like stockouts and overstocking.
Think your Shopify dashboard has inventory completely covered? While it's a powerful tool, Shopify mostly tracks what's happening in real-time within its own ecosystem. It doesn’t always give you the strategic, bird's-eye view you need to make proactive purchasing and operational decisions.
This is where a dedicated inventory sheet becomes a secret weapon for savvy merchants.
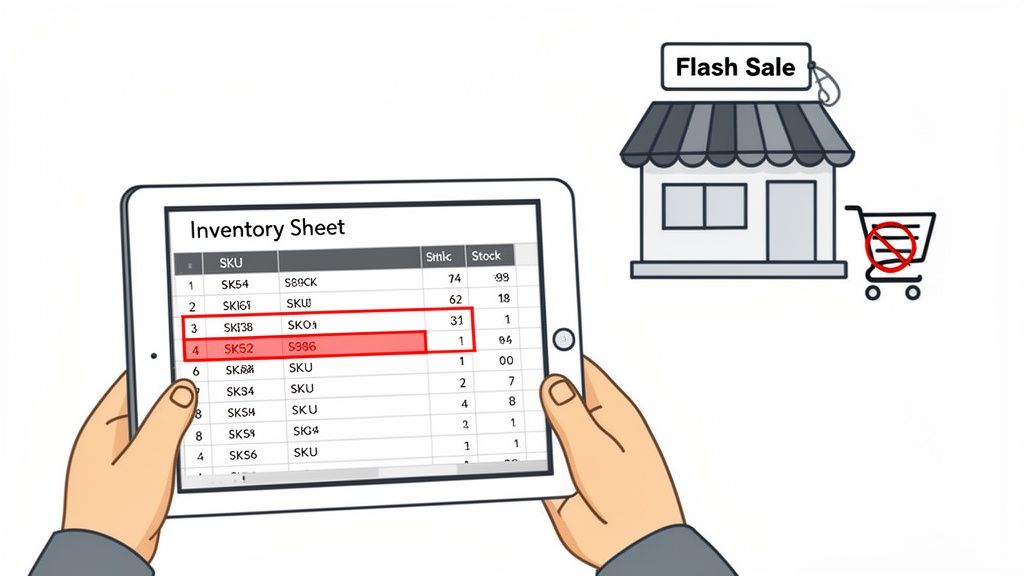
Imagine you run a growing apparel brand and a flash sale suddenly goes viral. Without a clear, centralized inventory sheet, you could easily oversell your most popular T-shirt size. The result? Frustrated customers, canceled orders, and a hit to your reputation. An inventory sheet acts as your command center, giving you instant clarity on exactly how many units of "Vintage Tee - Blue - Large" you actually have.
It also uncovers those hidden financial drains. By tracking the cost of goods right alongside your stock levels, you can quickly spot which products are tying up your cash. That slow-moving jacket might look great on your site, but your sheet will reveal it's been sitting in the warehouse for six months, silently costing you money.
A well-maintained inventory sheet turns reactive problem-solving into proactive strategy. It’s the difference between asking "What happened?" and deciding "What happens next?"
This single source of truth provides a level of detail that apps alone often can’t. It's no surprise that a staggering 63% of supply chain managers still use Excel for some form of inventory tracking. The stakes are high—stockouts can cost businesses up to 4% of sales, while overstock can tie up capital with 20-30% of inventory just sitting idle.
The key is turning this data tracking into a repeatable, consistent process. To keep your team on the same page and ensure your counts are always accurate, it's a good idea to build out a Standard Operating Procedure template for your inventory management workflows.
For a deeper dive into structured tracking, check out our complete guide on the best practices for inventory management. When you get this right, tracking transforms from a dreaded chore into a powerful strategic advantage that fuels sustainable growth.
Jumping into your first inventory sheet can feel like a huge task, but it’s much simpler than you might think. Your first real decision is just picking the right tool for the job. For most Shopify merchants, it really comes down to two options: Google Sheets or Microsoft Excel.
Google Sheets is fantastic for collaboration since it's cloud-based. You can access and update your inventory from anywhere, on any device, which is a game-changer if you have a small team. Excel, on the other hand, is still the undisputed champ for heavy-duty data analysis and works perfectly offline.
Honestly, if you're just starting out, Google Sheets is probably the easier entry point. Its sharing features are incredibly straightforward.
It doesn't matter which tool you choose—the structure of your sheet is what will make or break your inventory process. A well-organized sheet will grow right alongside your business. A messy one will just create massive headaches down the road. The goal is to build a solid foundation with the right data columns from day one.
Here’s the golden rule: each row in your sheet must represent a single, unique product variant. I can't stress this enough. If you sell a T-shirt in three sizes and three colors, that’s nine unique variants. That means you need nine separate rows in your spreadsheet to track everything accurately.
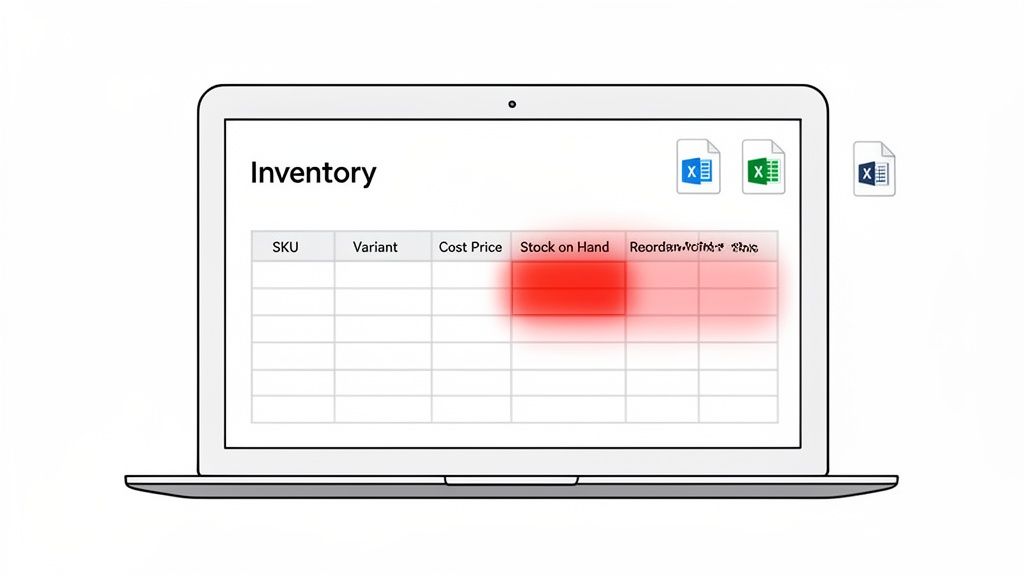
These are the non-negotiable columns you absolutely need to include:
A static list of products is fine, but a dynamic sheet that actively flags important info is way more powerful. This is where you can use some basic spreadsheet functions to make your life easier. You don't need to be a formula wizard to do it.
For starters, use conditional formatting. Set it up so the "Stock on Hand" cell automatically turns red when the quantity drops below a certain number, like 10 units. This simple visual cue makes it impossible to miss low-stock items when you're just glancing at your sheet.
Another incredibly useful trick is data validation. Apply it to your "Supplier Name" column to create a dropdown menu of your approved suppliers. This little step prevents typos and inconsistencies (like "Supplier A" vs. "supplier a") and keeps your data clean enough to actually filter and analyze. Mastering these small enhancements is a key part of the top inventory management techniques for Shopify.
Pro Tip: Don't start from scratch. Export your current product list from Shopify as a CSV file. This gives you a pre-populated template with all your SKUs and product names already in place. It will save you hours of mind-numbing data entry and ensures your sheet perfectly matches your store from the get-go.
A spreadsheet without formulas is really just a static list. To turn your inventory sheet from a simple log into a tool that actually helps you make decisions, you need to bring it to life with a few essential formulas.
These functions will automate your calculations, show you what's really happening with your stock, and help you manage everything proactively instead of just reacting to problems.
You don't need to be a spreadsheet guru, either. A couple of powerful formulas will handle most of what any Shopify merchant needs to track.
One of the most practical formulas you'll use is SUMIF. It lets you add up numbers in one column based on a specific piece of information in another. Think about it: what's the total value of all products from "Supplier A"? Or how many t-shirts do you have in stock across all sizes and colors?
Let's say your sheet has a 'Supplier' column (Column C) and a 'Stock Value' column (Column H). To find the total value of all inventory from a supplier named "Rugged Wear," you'd use this:
=SUMIF(C2:C100, "Rugged Wear", H2:H100)
This formula scans the supplier column for every instance of "Rugged Wear" and then adds up the corresponding values from the stock value column. It’s a dead-simple way to get a quick financial snapshot of your supplier dependencies.
As your sheet gets more complex, you might decide to keep your cost data on a separate "Supplier Costs" tab to keep the main view clean. This is where VLOOKUP becomes your best friend.
It can look up a value (like a SKU) in a different table or tab and pull related data back into your main sheet. It saves a ton of manual copy-pasting and prevents errors.
If you want to pull the 'Cost Price' from your "Costs" tab into your main inventory sheet, the formula would look something like this:
=VLOOKUP(A2, Costs!A:B, 2, FALSE)
This tells your spreadsheet to:
1. Take the SKU from cell A2 in your main sheet.
2. Search for that exact SKU in the first column of your "Costs" tab.
3. When it finds a match, return the value from the second column in that row (your cost price).
4. The FALSE at the end is crucial—it ensures you only get an exact match.
By getting comfortable with a few formulas like these, your inventory sheet stops being a record of the past and becomes a tool for making smarter future decisions. You can spot trends and answer important business questions in seconds.
The most strategic formula you can set up is one that automatically flags items that need to be reordered. This simple "Reorder Point" check is your first line of defense against stockouts.
At its core, the calculation involves your average daily sales and the lead time from your supplier. For a more robust system, it’s always smart to factor in a buffer for unexpected demand spikes. We call this safety stock.
Calculating this buffer is a huge part of smart inventory management. You can learn more about the specifics in our detailed guide on how to calculate safety stock.
A basic reorder flag in your sheet could be as simple as: =IF(D2<=E2, "Reorder", "OK"). In this case, D2 is your "Stock on Hand" and E2 is your "Reorder Point." Just like that, your sheet is telling you what needs attention.
An inventory sheet sitting in a folder by itself is a recipe for disaster. It gets stale, fast. For this system to actually work, your spreadsheet needs to become an active partner to your Shopify store, not just a passive record of what you think you have.
Think of it this way: your sheet becomes the command center. You'll use it to make bulk updates, verify your physical counts, and maintain a single, reliable source of truth for your stock levels. This is how you stop guessing and start managing your inventory with confidence.
Before you do anything else, you need to pull your data directly from the source. Don't even think about building your inventory sheet from memory or old order forms.
Hop into your Shopify admin, go to Products, and hit that Export button. This will generate a CSV file of your entire product catalog. This is your ground zero.
Why is this so critical? Because it ensures every single SKU in your spreadsheet perfectly matches what's in Shopify's system. One tiny typo in a SKU can derail your entire process, and starting with an export eliminates that risk from day one. It’s a simple click that saves hours of future headaches.
One of the most common mistakes I see is merchants creating SKUs in their spreadsheet that don't actually exist in Shopify. By starting with a direct export, you guarantee perfect SKU mapping from the get-go. This isn't just a best practice; it's non-negotiable for doing bulk updates correctly.
Once you have this raw file, you can start cleaning it up and adding the other essential columns we talked about, like cost price, supplier info, and your physical count columns.
A spreadsheet is only as smart as the data you feed it. To make sure it reflects what's actually sitting on your shelves, you have to get your hands dirty with regular physical counts. It's the only way to catch the inevitable discrepancies from damages, returns, or even supplier mis-shipments.
The right cadence for you will depend on your sales velocity, but here's a solid routine to start with:
Okay, this is where all that prep work pays off. After you've done a physical count, you'll update the "Stock on Hand" numbers in your inventory sheet.
Now, instead of painstakingly adjusting hundreds of products one-by-one in the Shopify admin, you’ll use the bulk import tool.
Since your SKUs are perfectly aligned, Shopify can instantly read your updated CSV and adjust the inventory levels for every single product in one shot. This simple workflow—Export, Count, Update Sheet, Import—transforms what could be an entire day's work into a streamlined, manageable task.
This data can also fuel more advanced inventory strategies. For businesses in fast-moving industries, AI can analyze this kind of historical data to create demand forecasts with 85-95% accuracy, which can massively cut down on reordering mistakes. If you're curious about where this is all heading, you can learn more about how AI is changing inventory management in this detailed industry report.
Your meticulously maintained inventory sheet is more than just a record of what's happened; it's a goldmine of historical data. But what about the future? While spreadsheets are essential for getting your numbers right, they have some pretty clear limits when it comes to predicting what’s next.
A static sheet struggles to anticipate the seasonal rush for your best-selling summer apparel or spot the subtle sales trends that signal a product is about to take off. It can tell you what you sold last month, but it can't reliably tell you what you will sell next month. That’s the natural ceiling you eventually hit with manual tracking.
The simple workflow of exporting your data, counting your stock, and updating the sheet is the foundation for keeping your Shopify data clean and accurate.

This loop between your physical stock and your digital records is what makes more advanced analysis even possible down the line.
The clean, organized data from your inventory sheet is the perfect launchpad for smarter, automated systems. Think of your spreadsheet as the fuel and an AI-driven platform as the engine. These tools can ingest your sales history and current inventory levels to generate precise, data-driven purchasing recommendations.
Instead of trying to manually calculate reorder points, an adaptive forecasting engine can project future demand for you, flagging potential stockouts weeks in advance. It’s a huge shift, moving you from being reactive and just counting what you have, to being proactive and planning for what you’ll need.
Your sheet isn't the end of the road; it's the beginning of a smarter inventory strategy. It provides the clean, reliable data needed to power truly intelligent forecasting.
Holding onto unsold products is a massive financial drain. In fact, excess inventory costs can eat up 20-30% of your total holding expenses. For Shopify merchants, a tool with an adaptive forecasting engine is the key to dodging these costs. It analyzes your historical sales and market signals to recommend exactly what adjustments to make.
The end game here is simple: make purchasing decisions based on data, not guesswork.
By connecting the data from your inventory sheet to a more powerful analytics platform, you can finally answer critical business questions with confidence. You’ll know exactly when to reorder, how much to buy, and which products are silently eating away at your profits.
Once you feel you've outgrown the basic spreadsheet, exploring the best inventory management software is the logical next step to seriously boost your operational efficiency. This is how you graduate from simply tracking inventory to strategically managing it for maximum growth.
Even with the best template in hand, you're bound to run into a few hurdles when you start managing inventory in a spreadsheet. It happens to everyone. Getting straight answers to these common challenges is the key to keeping your system accurate and genuinely useful. Let's tackle some of the most pressing questions I hear from Shopify merchants.
Here’s the deal: an outdated inventory sheet is worse than no sheet at all. It leads to bad buying decisions, surprise stockouts, and a whole lot of stress. Consistency is everything.
The right frequency really depends on your sales volume, but there's a solid baseline everyone should follow. Aim for a full, wall-to-wall physical count and reconciliation once a month. Think of this as your monthly reset, the moment you make sure your spreadsheet perfectly mirrors what's on your shelves.
But for daily operations? You need to be updating it far more often. New stock from suppliers and daily sales figures should be logged either daily or, at a minimum, weekly. If you're a high-volume seller, I'd also recommend spot-checking your top-selling products every week to catch any weird discrepancies before they snowball.
Yes, and you absolutely have to. The single biggest mistake I see new merchants make is lumping all variants—like sizes and colors—into a single row. For the kind of granular control you need for smart inventory management, every unique variant needs its own dedicated row. No exceptions.
This means a t-shirt sold in three sizes and three colors needs nine separate rows in your sheet. Each of those rows gets its own unique SKU (e.g., TEE-BLUE-L, TEE-BLUE-M, TEE-RED-S). It might seem like more work upfront, but this structure is what lets you track the precise stock levels, costs, and sales velocity for every single option you sell. It's how you avoid selling out of your most popular size while being stuck with a mountain of the least popular one.
The whole point of an inventory sheet is clarity. Giving each variant its own row is the only way to get a true picture of what’s selling and what’s collecting dust.
Besides fumbling variants, the most damaging mistake is simply inconsistent data entry. Little typos and forgotten updates might not seem like a big deal, but they compound over time and can completely corrupt your data, making your sheet totally useless. This includes things like using slightly different product names, forgetting to log a new shipment, or not tracking damaged goods.
The fix is building a standard process and sticking to it religiously. A great trick is to use spreadsheet features like data validation to create drop-down menus for things like suppliers or categories. This simple move enforces consistency and drastically cuts down on human error, keeping your data clean and trustworthy.
Ah, the classic headache. This frustrating gap is known as inventory shrinkage, and it’s a problem for nearly every retailer. If your sheet and your shelves are constantly at odds, the first thing to do is a full, wall-to-wall physical count. You need to establish a new, 100% accurate baseline to work from.
From there, it's all about tightening up your operations. Make sure that every single return, exchange, and damaged item is meticulously logged. If you’re still seeing discrepancies, you might need to look for deeper issues like supplier short-shipments or even theft.
A great practice to adopt is "cycle counting"—regularly checking small, specific sections of your inventory instead of waiting for the big monthly count. This helps you pinpoint and solve these inventory mysteries much, much faster.
Ready to move beyond spreadsheets and guesswork? Tociny.ai uses AI to analyze your sales data, forecast demand, and provide clear, actionable recommendations to prevent stockouts and reduce overstock. Join the private beta today and transform your inventory management.
Tociny is in private beta — we’re onboarding a few select stores right now.
Book a short call to get early access and exclusive insights.